

New York recorded a higher homicide rate than London in 2025. London’s police-recorded rape and theft-from-the-person figures were higher than the New York categories used in my carousel. I examined the city totals and the demographic breakdowns behind them. Here are the sources, calculations and the limits of comparing two different recording systems.
By Doggy. Adapted from my Instagram carousel, posted 30 October 2026.

Homicide: the clearest city-level comparison
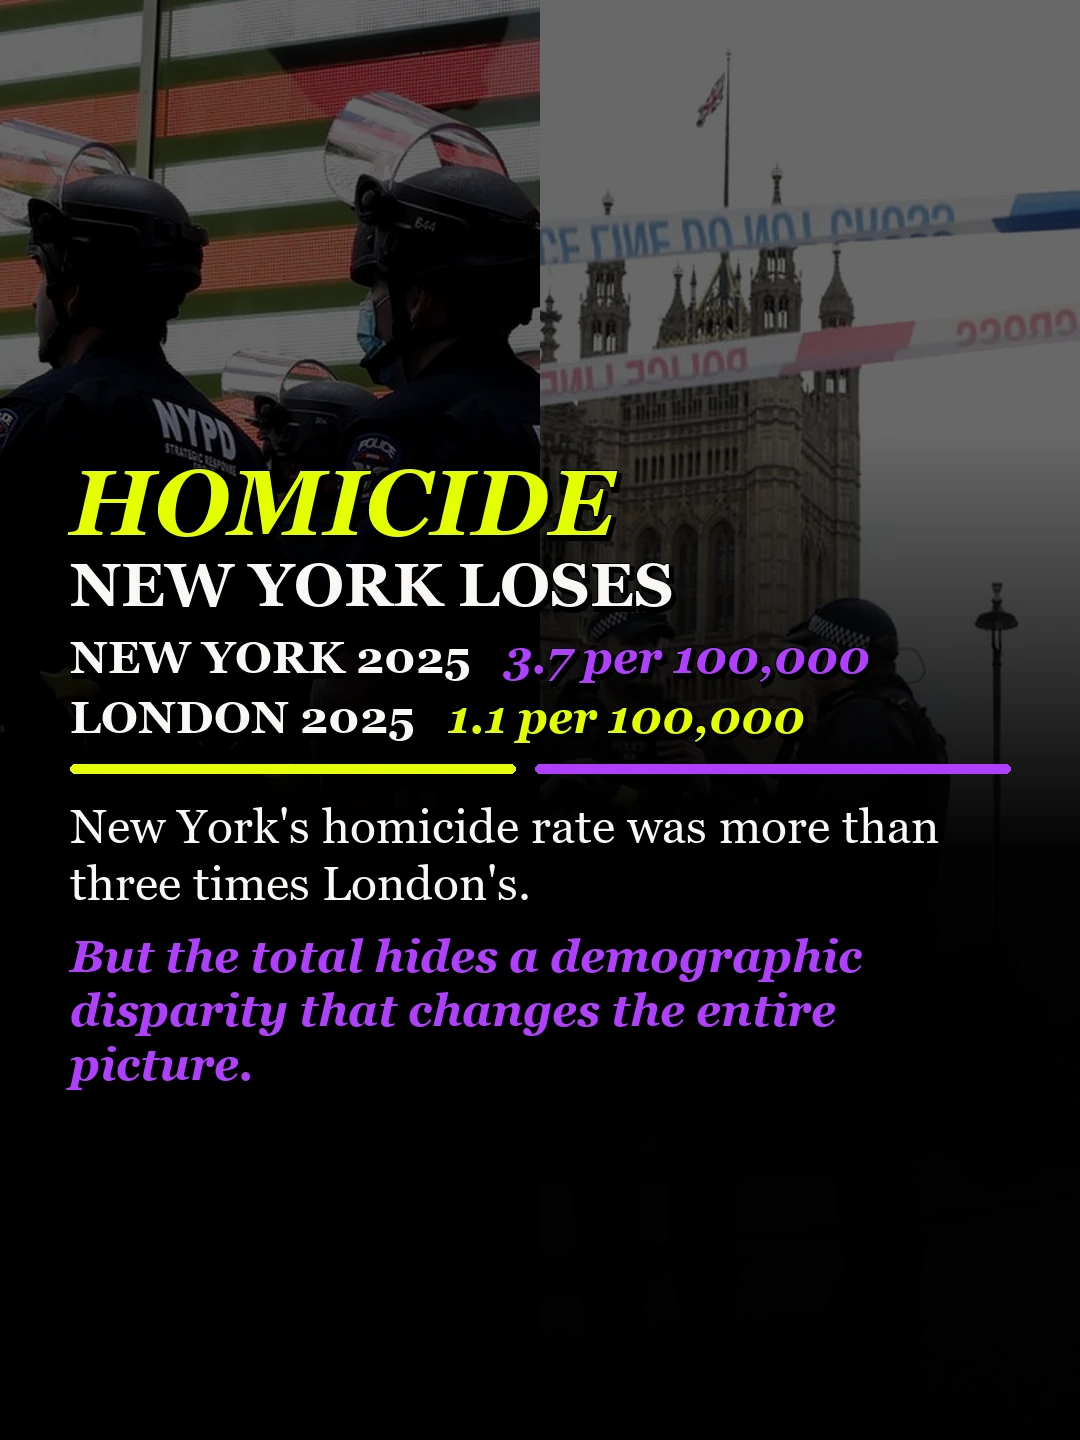
NYPD’s 2025 year-end release reports 305 murders. Using the approximately 8.26 million population benchmark in NYPD’s demographic report gives 305 ÷ 8,258,035 × 100,000 = 3.69 per 100,000, rounded to 3.7 in the carousel.
The Metropolitan Police reports 97 homicides and a rate of 1.1 per 100,000 in 2025. On these figures, New York’s rate is about 3.4 times London’s. The Met’s release itself quotes a different New York comparator of 2.8 without explaining the underlying period or denominator; my 3.7 figure is calculated from the NYPD total and the population benchmark above.
New York’s known murder-suspect breakdown
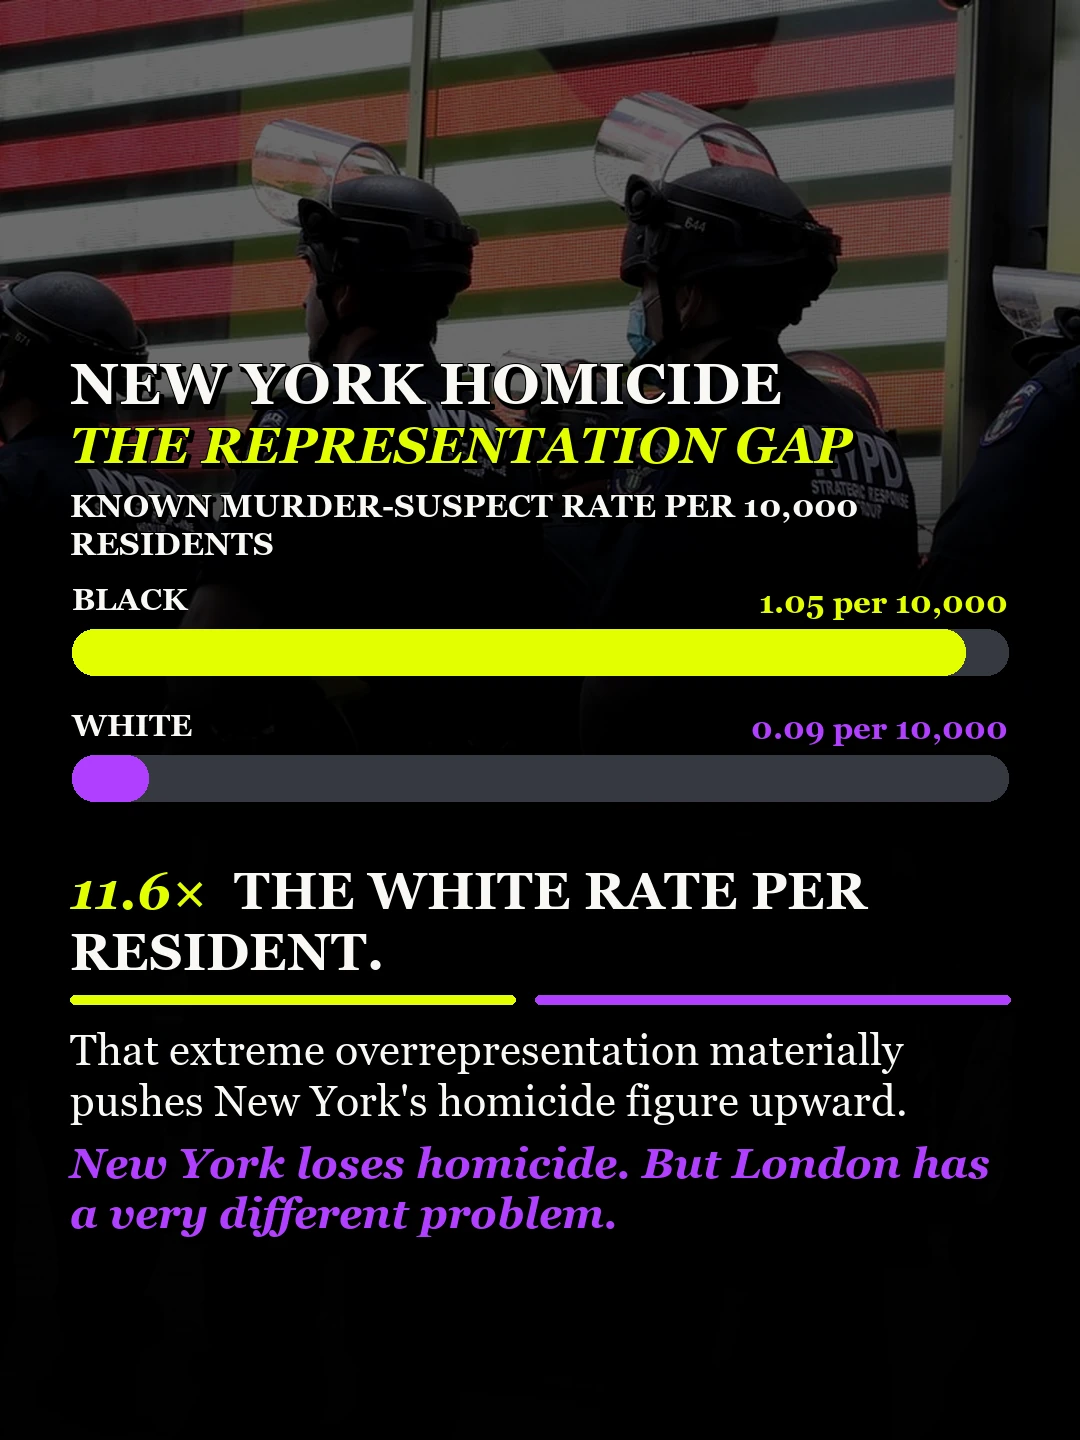
NYPD’s separate 2024 demographic report lists 330 murder suspects with known race or ethnicity: 53.3% Black and 7.0% White. Its population appendix gives 1,677,436 Black non-Hispanic residents and 2,560,722 White non-Hispanic residents, using 2023 ACS estimates.
Applying those rounded suspect shares gives approximately 1.05 versus 0.09 known-suspect entries per 10,000 residents. The share-based ratio is (53.3 ÷ 20.3) ÷ (7.0 ÷ 31.0) = 11.6. This is a descriptive, unadjusted comparison, not a finding about the cause of the difference. Suspect entries do not necessarily represent unique residents or convictions.
Recorded rape: the periods and definitions matter
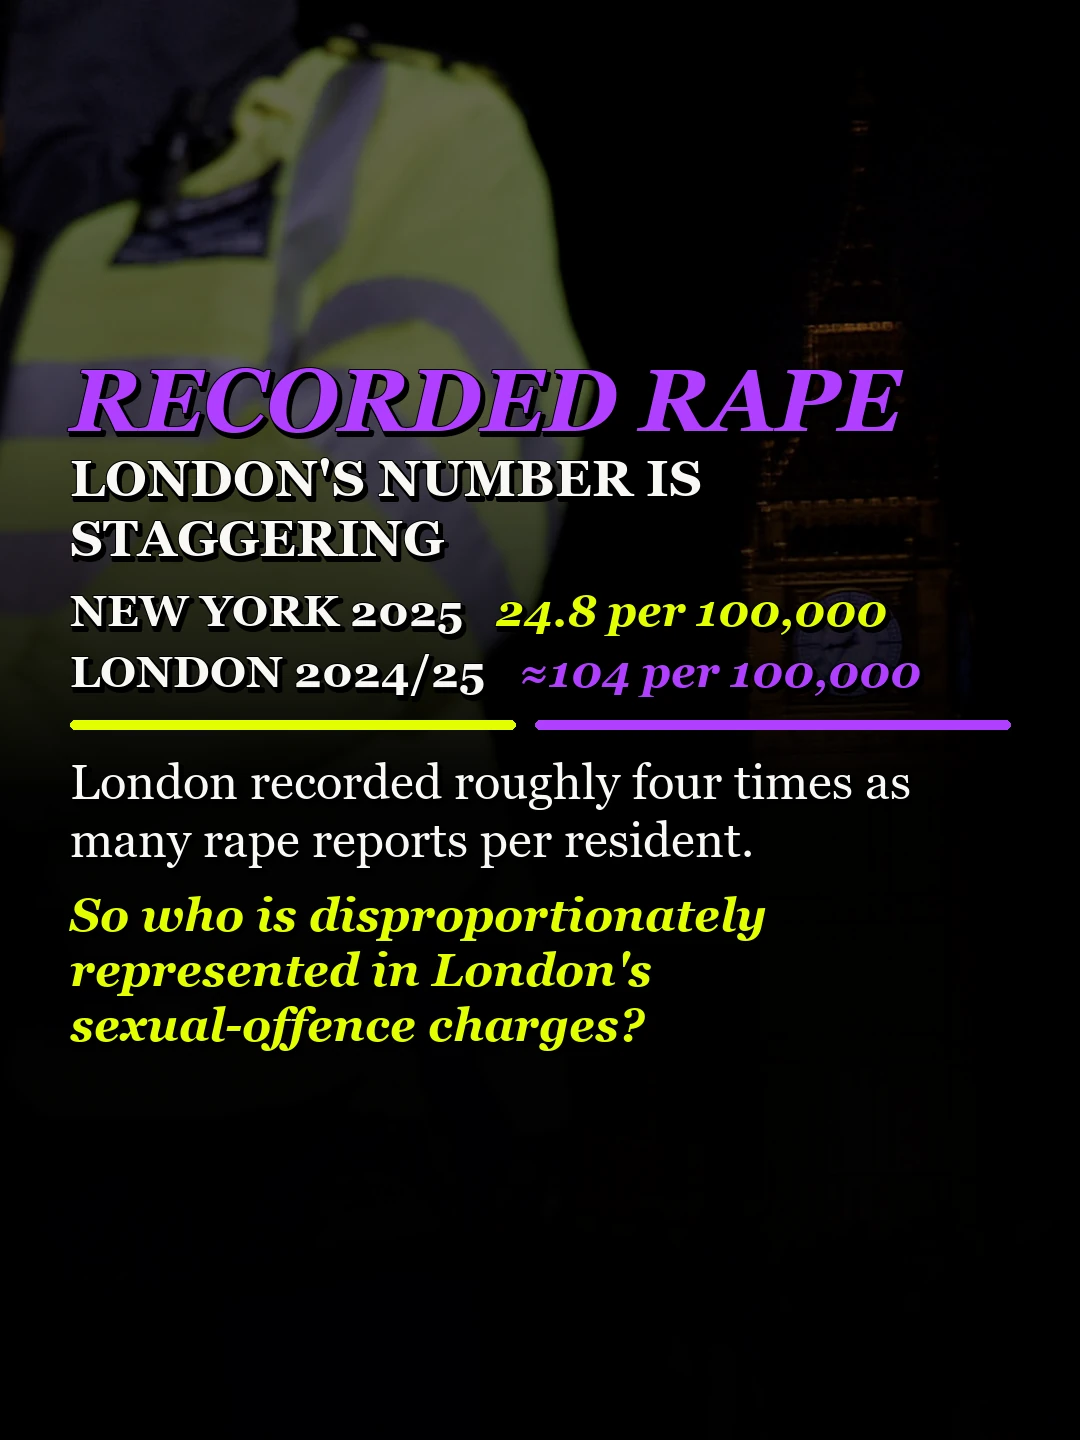
New York recorded 2,049 rape reports in calendar 2025, approximately 24.8 per 100,000 using the same population benchmark. London’s MOPAC report lists 9,346 recorded rapes from June 2024 to May 2025, approximately 104 per 100,000 using a rounded population of nine million.
The recorded-rate ratio is about 4.2. It is not a precise comparison of the underlying probability of victimisation: the periods, legal definitions, reporting practices and recording systems differ. NYPD notes that New York’s legal definition broadened in September 2024. Recorded reports are not interchangeable with convictions or the full number of offences occurring.
London’s sexual-offence charge comparison
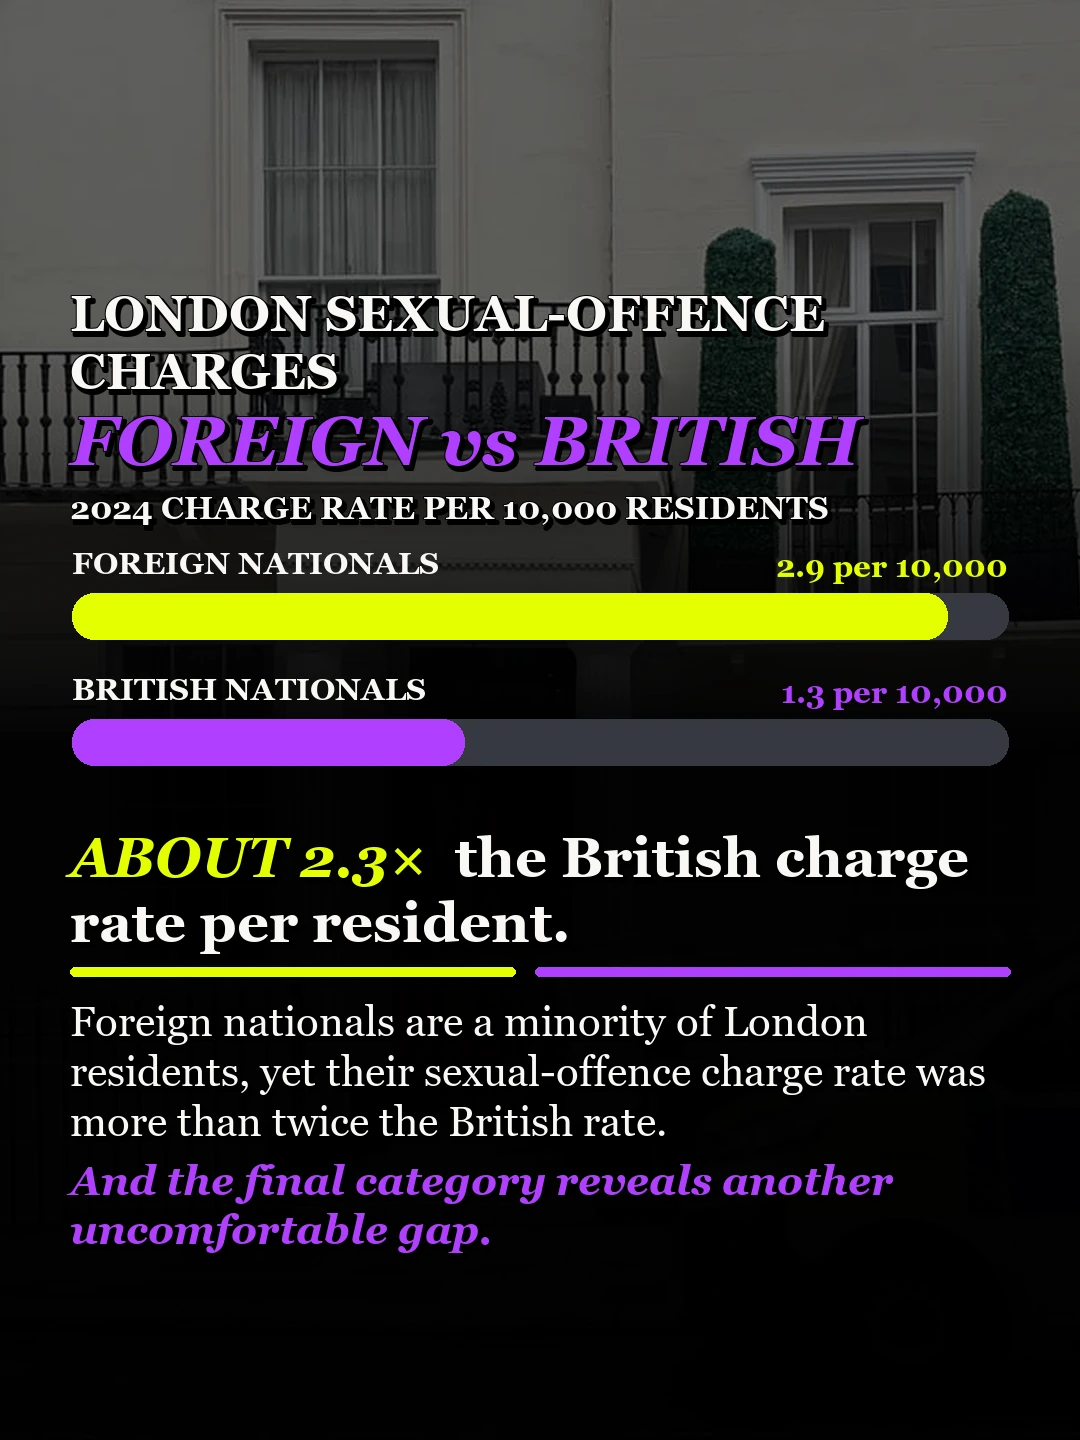
The carousel’s 2024 nationality figures come from the Centre for Migration Control’s published account of a Met FOI response: 597 foreign-national entries, 855 British-national entries and 149 with unknown nationality. Among the 1,452 entries with known nationality, the foreign-national share is 597 ÷ 1,452 = 41.1%. Unknown cases should not automatically be assigned to foreign nationals; the source’s “up to 47%” headline depends on assumptions.
The relative-rate calculation in the workings is (597 ÷ 23.3) ÷ (855 ÷ 76.7) = 2.30. The slides show roughly 2.9 versus 1.3 per 10,000 using a London population close to nine million and coarse rounding. The ratio uses the underlying figures rather than dividing the rounded bar labels.
This is an approximate reconstruction, not a directly published official nationality-specific rate. The 23.3% denominator is the 2021 Census share holding a non-UK passport. Its complement is not an exact count of British citizens: passport status, citizenship, dual nationality and having no passport are different categories. The population year also predates the 2024 case data. Nor is there proof every person charged was a London resident.
The separate Met disclosure linked in the original workings covers 2019–2023, so it cannot independently verify the 2024 numbers. I attribute those numbers to the published 2024 FOI analysis and link both sources below. Charges or cases proceeded against do not establish guilt.
Theft: two categories rather than a direct league table
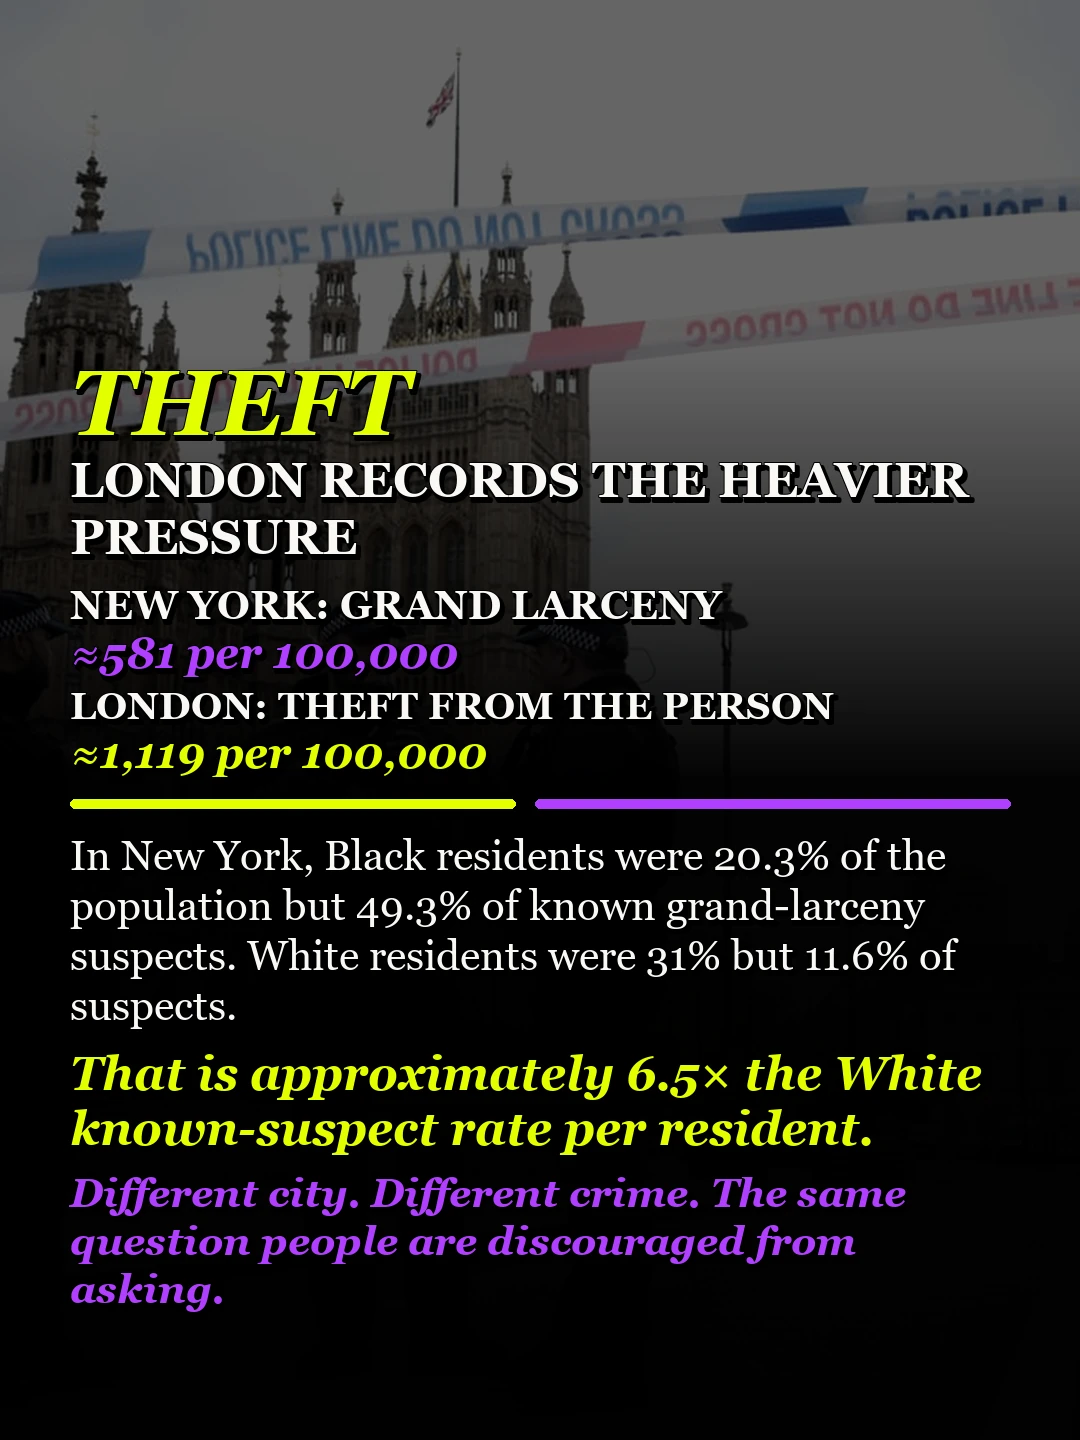
New York’s 48,034 grand larcenies in 2025 give approximately 582 per 100,000 using 8,258,035 residents, close to the carousel’s rounded 581. London’s 100,125 theft-from-the-person offences in June 2024–May 2025 give about 1,119 per 100,000 with an 8.95 million denominator.
Grand larceny and theft from the person are not equivalent legal categories. These figures cannot establish that London’s overall theft rate is twice New York’s. The NYPD 2024 suspect-share calculation shown in slide 6 is (49.3 ÷ 20.3) ÷ (11.6 ÷ 31.0) = approximately 6.5, again an unadjusted descriptive ratio.
What this comparison can establish
The sources show different recorded crime patterns and substantial disparities within particular suspect or case datasets. They do not isolate the effects of a mayor, political ideology, ethnicity or nationality. The demographic ratios are not adjusted for age, sex, geography, visitor populations or other relevant factors. I have retained the original slides and set out these qualifications so readers can check what each figure measures.
Sources and workings
- NYPD 2025 year-end crime release: murder, rape and grand-larceny totals.
- NYPD Crime and Enforcement Activity in New York City, 2024: murder and grand-larceny suspect tables and Appendix B population estimates.
- Metropolitan Police: 2025 homicide figures.
- London Assembly/MOPAC report, June 2025: PDF page 4, June 2024–May 2025 recorded crime totals.
- ONS Census 2021: international migration: London’s non-UK passport share.
- Centre for Migration Control’s July 2025 FOI analysis: reported 2024 nationality figures and attached spreadsheets.
- Separate Met nationality disclosure for 2019–2023, included for context rather than as verification of 2024.
The full original carousel
The remaining six slides are below, uncropped. Read them alongside the definitions and source notes above.

More independent research
Browse my research topics or read my ICE and FBI data report.
Support the work
I study the sources and create the content myself. Support my work on Buy Me a Coffee or send a correction or source suggestion.