

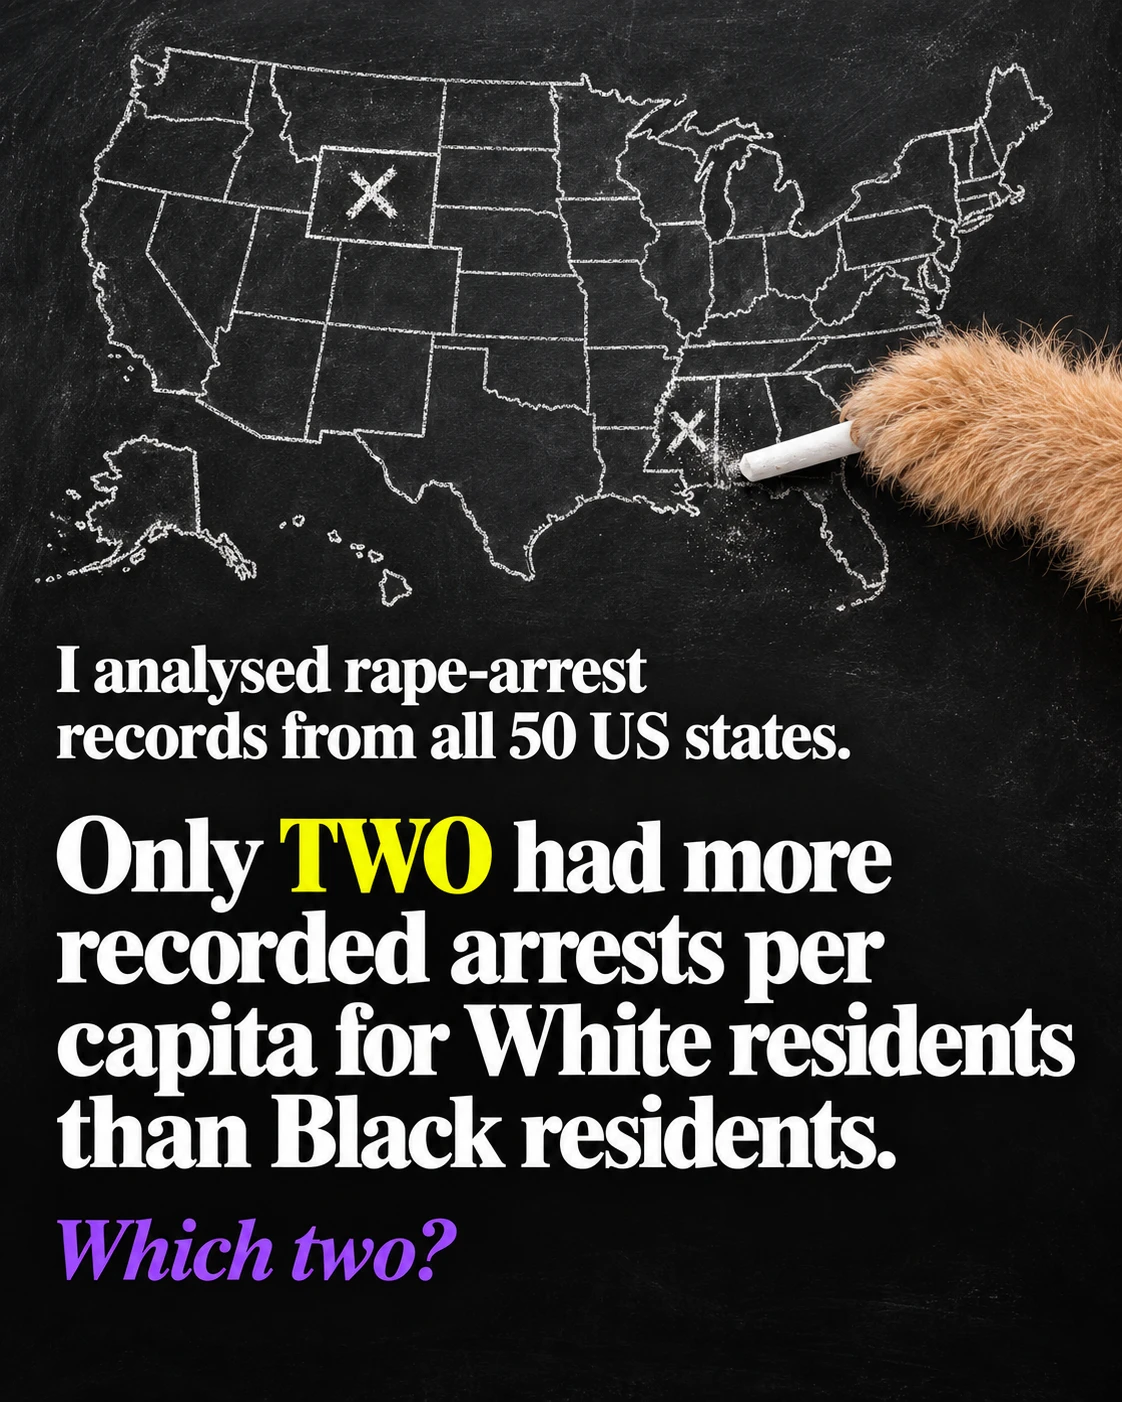
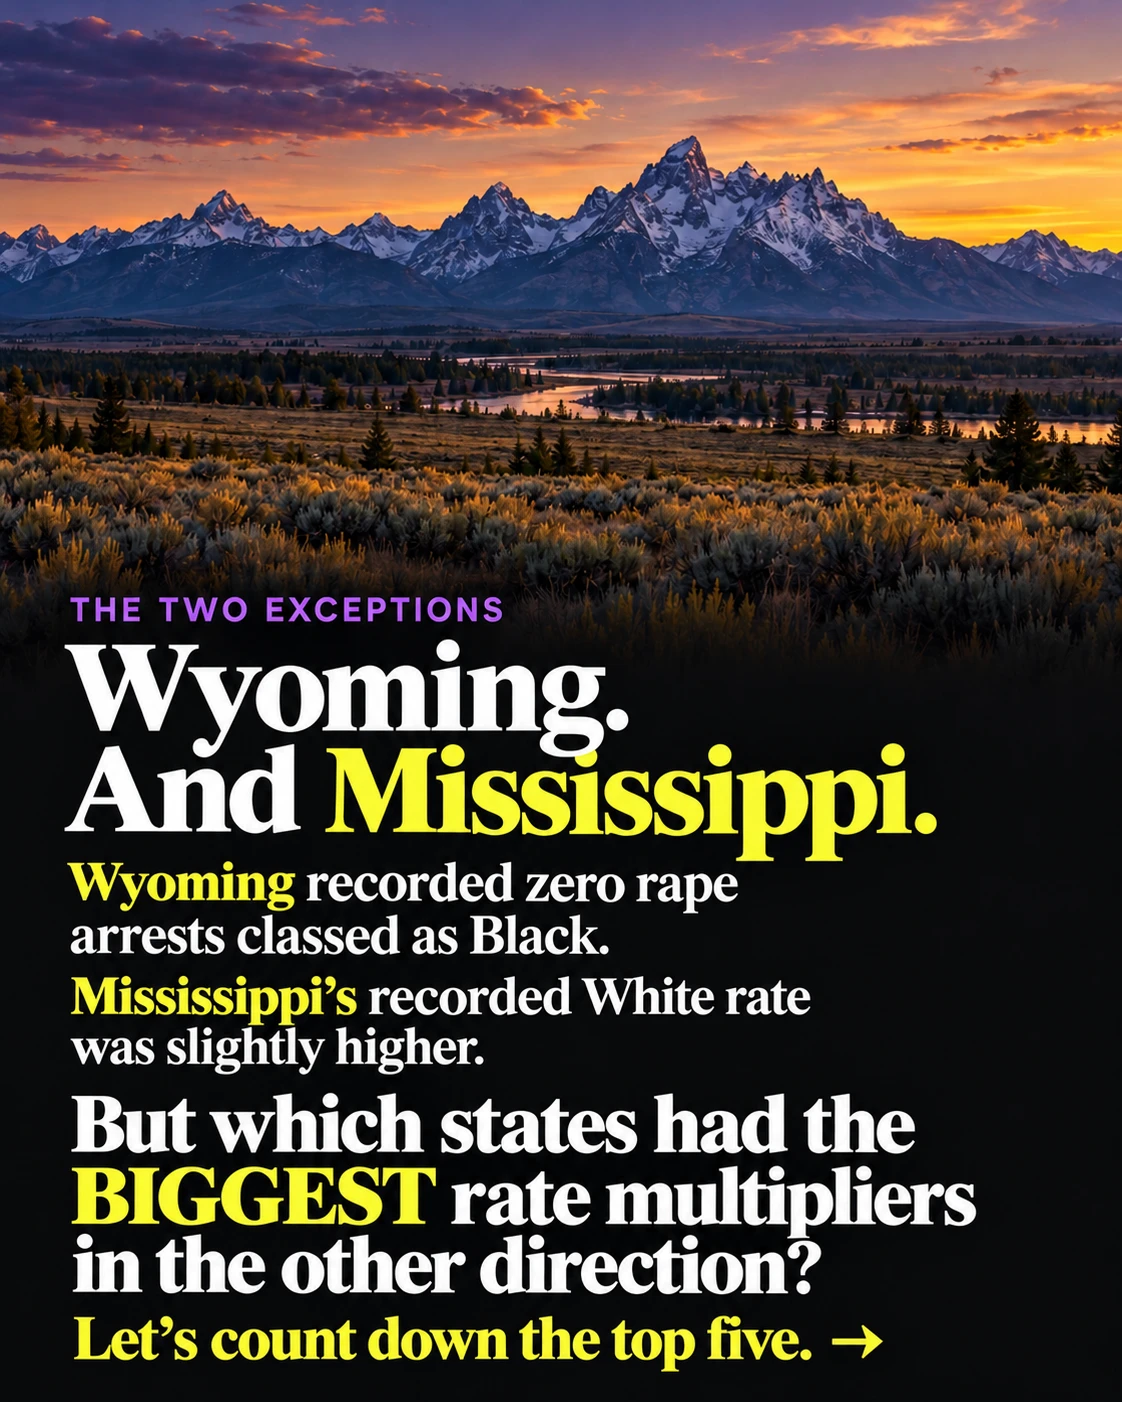
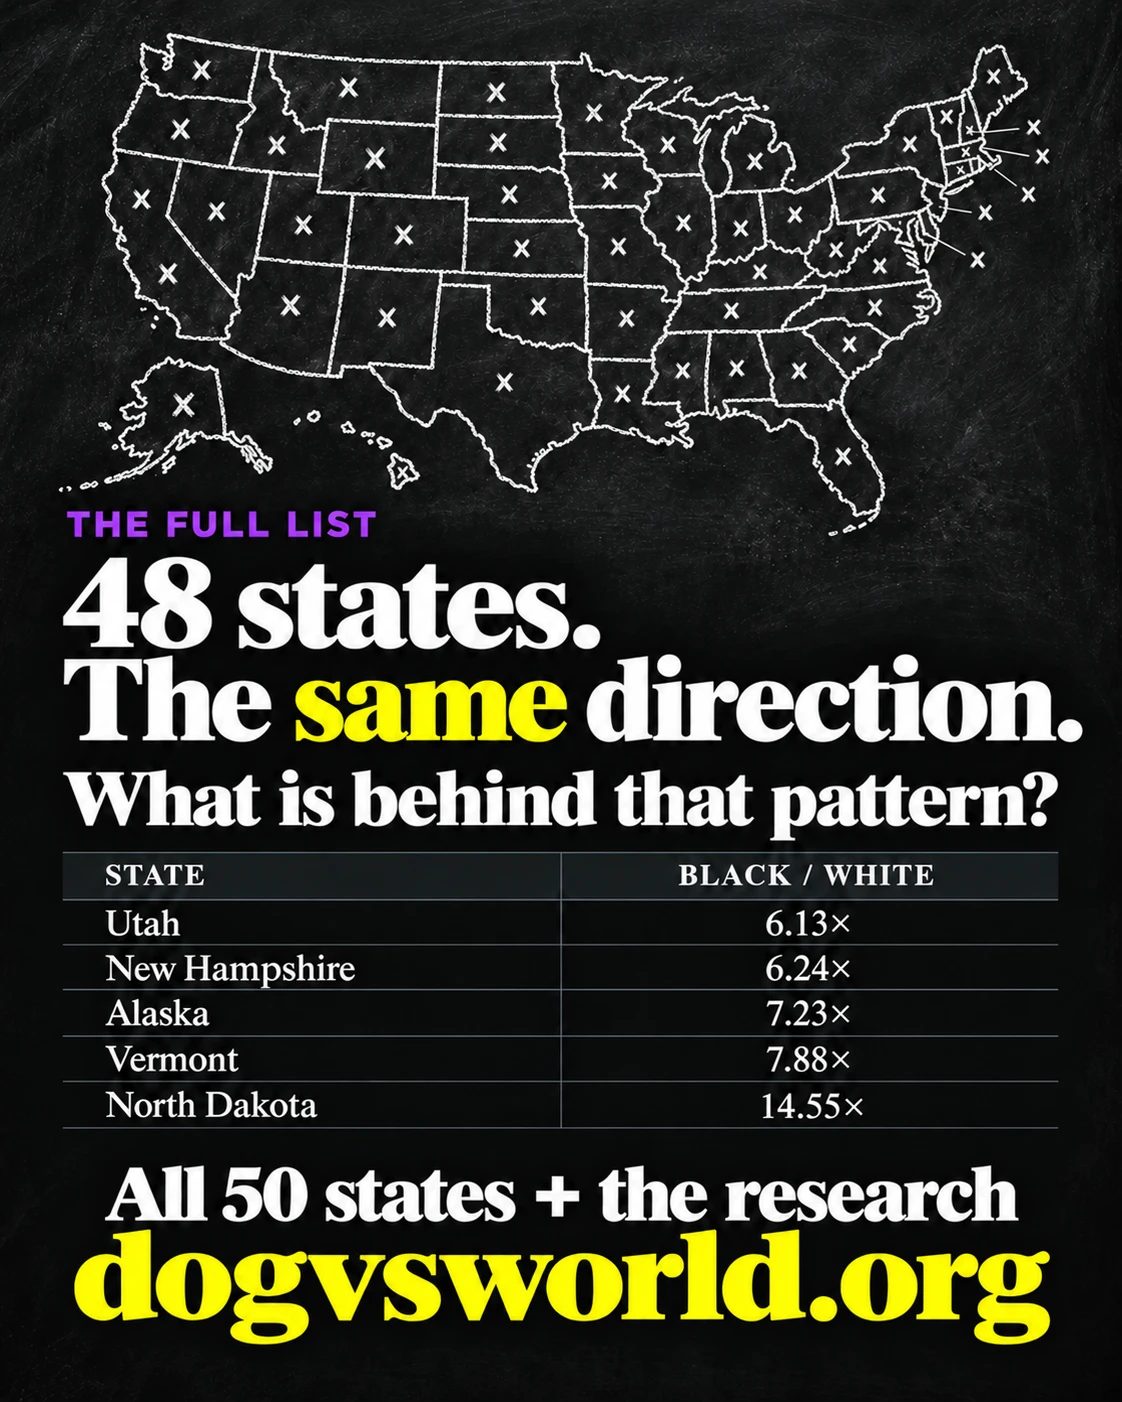
I analysed the available 2024 rape-arrest records for all 50 US states. In 48 states, recorded arrests per resident were higher in the Black category than in the White category. Wyoming and Mississippi went the other way. North Dakota had the largest Black-to-White multiplier, at 14.55×. Here are the counts, denominators and full workings.
By Doggy. Original data analysis and commentary, adapted from my Instagram carousel. Published 2 November 2026.
What this comparison measures
These figures divide arrests appearing in the downloaded FBI file by each state’s full group population. They are descriptive ratios of the available records, not coverage-adjusted statewide arrest estimates, conviction rates or measurements of underlying offending. Missing agencies, months and demographic entries can affect the comparison. The pattern alone does not identify its causes.
North Dakota: how the 14.55× figure was calculated
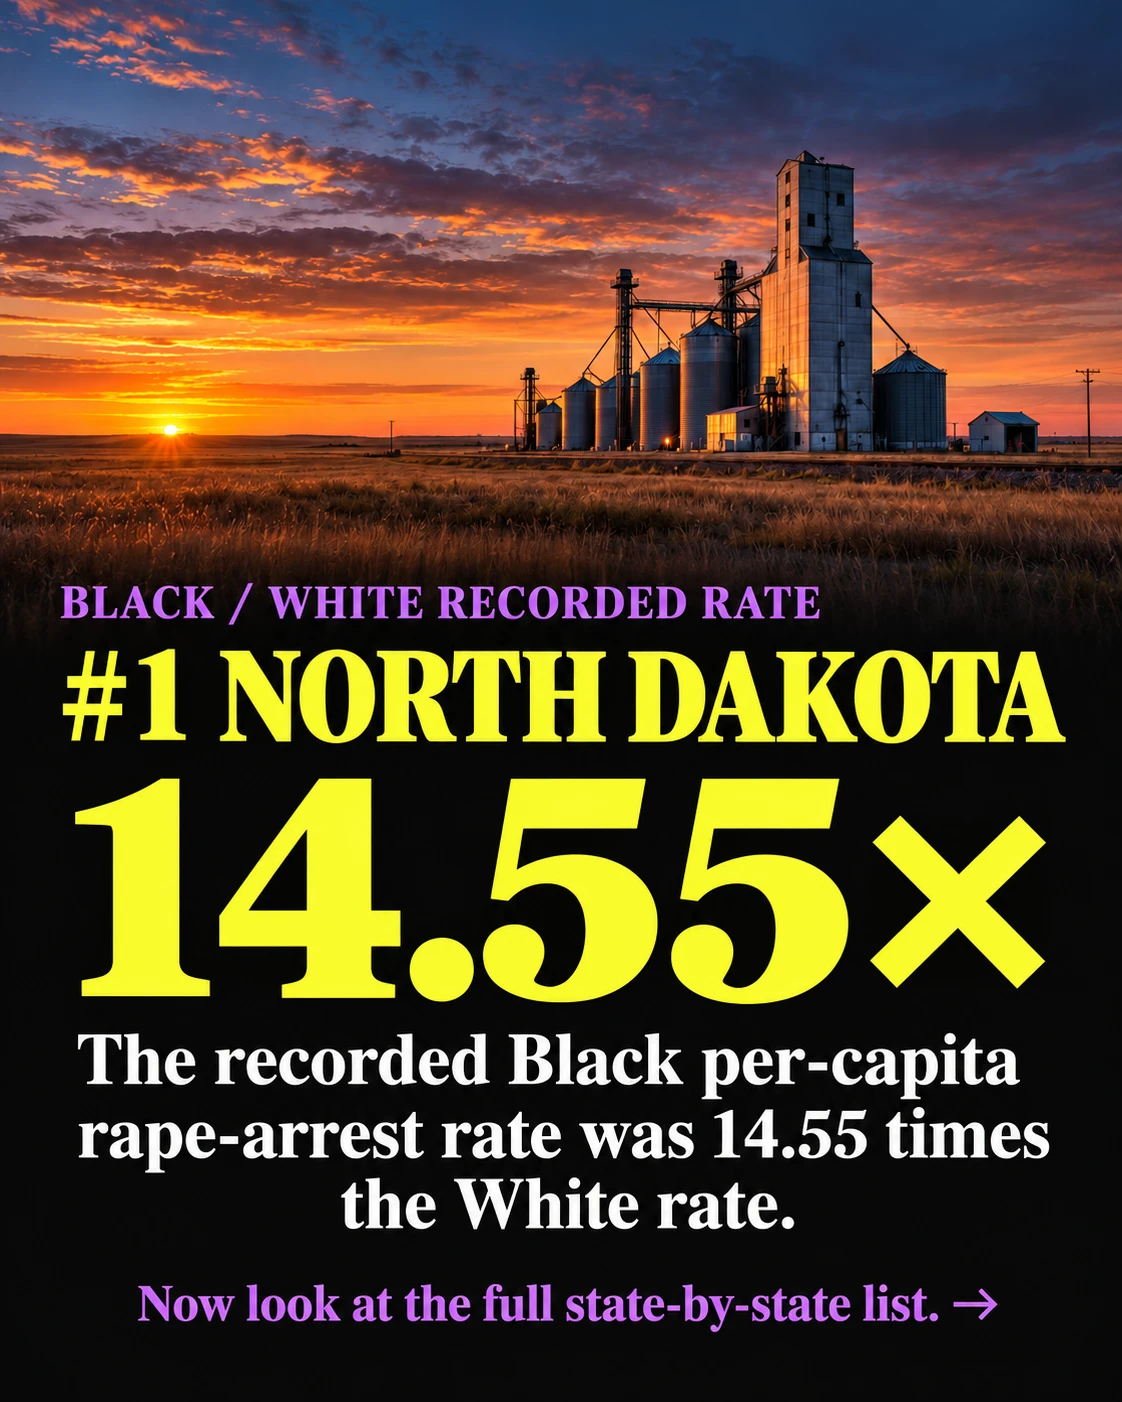
The file records 15 arrests in the Black category and 22 in the White category. The corresponding population denominators are 31,985 and 682,429. That gives 15 ÷ 31,985 × 100,000 = 46.90 and 22 ÷ 682,429 × 100,000 = 3.22. Dividing the unrounded figures gives 14.5472, displayed as 14.55×. The small numerator of 15 is important: a handful of records can substantially change the ratio.
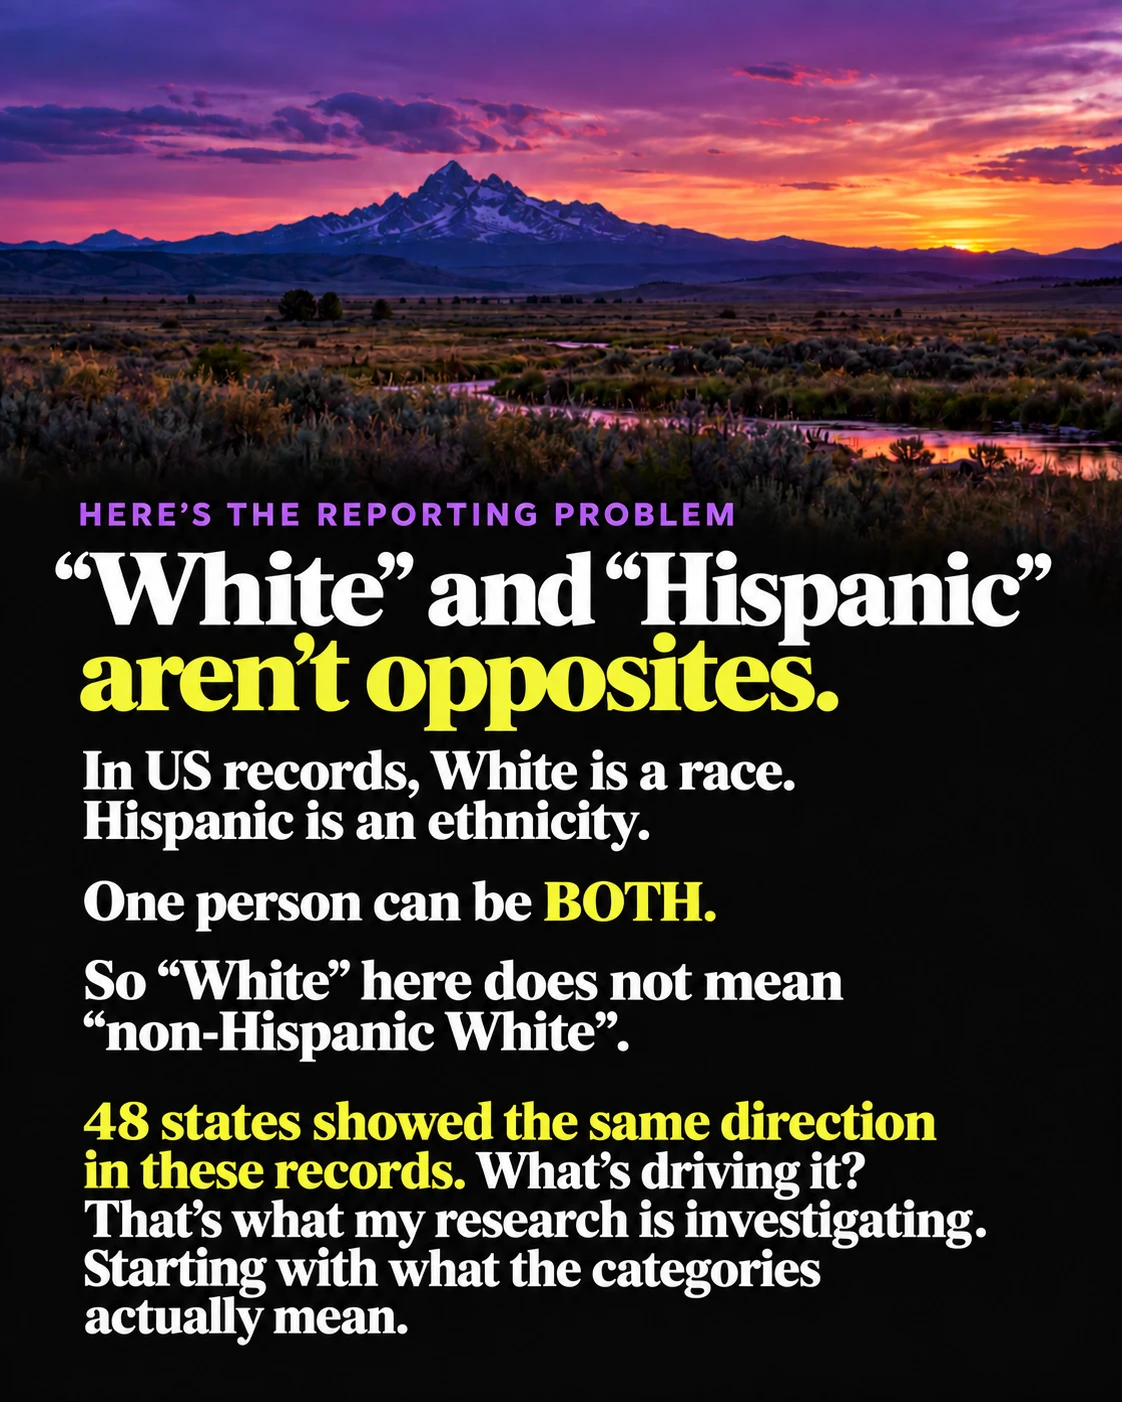
White does not mean non-Hispanic White
Race and Hispanic ethnicity are separate, overlapping fields. A person can be recorded as both White and Hispanic. The available file does not provide a joint race-by-ethnicity cross-tabulation, so subtracting the Hispanic subtotal from the White subtotal would not produce a valid non-Hispanic White figure.
Why I have published the full tables
A headline multiplier should be open to inspection. Below are all states and Washington, DC, including the recorded counts, rates and methodological notes. DC is included in the tables but excluded from the statement about 48 of 50 states. A zero means no arrests recorded in that field of the available file, not proof that no arrests or offences occurred in that state.
Calculated 2 November 2026. All 50 states plus Washington, DC. These are descriptive ratios of arrests appearing in the downloaded FBI ASR master file to the full state's July 2024 group population. They are NOT coverage-adjusted estimates of statewide arrest rates or offending rates, and should not be used as a league table of racial propensity to commit crime. Missing agencies, missing months and missing demographic entries reduce or distort coverage. This analysis does not establish which group has the highest true statewide arrest or offending rate.
Sources and calculation
FBI Crime Data Explorer, Documents & Downloads > Master File Downloads > Arrest > 2024. Downloaded 2 November 2026. Public master-file resolver: https://cde.ucr.cjis.gov/LATEST/s3/signedurl?key=master_files%2Fasr%2Fasr-2024.zip
FBI ASR documentation: https://cde.ucr.cjis.gov/LATEST/s3/signedurl?key=master_files%2Fasr%2Fasr-help.zip
Census Vintage 2024 state population estimates: https://www2.census.gov/programs-surveys/popest/datasets/2020-2024/state/asrh/sc-est2024-alldata6.csv
Census layout: https://www2.census.gov/programs-surveys/popest/technical-documentation/file-layouts/2020-2024/SC-EST2024-ALLDATA6.pdf
FBI download interface: https://cde.ucr.cjis.gov/LATEST/webapp/#/pages/downloads
Numerator: sum juvenile and adult arrests in offense code 020 from asr-2024.txt, including partial-year reporting. Race and ethnicity counts are separate reported subtotals; neither necessarily equals the age/sex arrest total. The 020 label in the supplied layout is 'Forcible Rape'; this extraction preserves the master-file category and does not independently resolve agency-specific legacy/revised rape definition differences. Other sex offenses (170) are excluded. Arrests are events, not unique people or convictions. Both sexes and all ages are included.
Denominator: sum single ages, SEX=0, ORIGIN=0 for each race; RACE=1 White alone, 2 Black alone, 3 American Indian/Alaska Native alone, and 4+5 Asian alone plus Native Hawaiian/Other Pacific Islander alone. Ethnicity denominators sum all six race categories for ORIGIN=2 Hispanic and ORIGIN=1 non-Hispanic. Census race categories are self-identified and modified for population estimation, while police classification can differ. No age adjustment or reporting correction was applied.
Formula: recorded group arrests / full-state group resident population * 100,000.
Category limits
White includes people recorded as White regardless of Hispanic origin; it is not non-Hispanic White. Hispanic and non-Hispanic are separate ethnicity measures that overlap race categories. Never add those columns to racial columns. The file has no joint race-by-ethnicity counts, so non-Hispanic White and Hispanic White rates cannot be calculated. The ASR layout supplies four race bins, including one Asian bin (historically Asian/Pacific Islander); it does not separately supply NHPI or multiracial counts. Do not interpret unavailable categories as zero. A displayed 0.00 means zero recorded arrests in that field, not that no offenses or arrests occurred statewide. Small nonzero numerators (<20) are marked *; this is an analyst-selected caution threshold, not an FBI suppression rule. Unmarked values can still have incomplete coverage.
Verification
Each of the 51 annual state/DC age/sex rape totals exactly matches independently summed monthly 020 records. No duplicate monthly rape keys were found. Two annual ORIs have records in different population groups; these were retained because their combined totals reconcile with monthly records. Nebraska is coded NB in the historical ASR identifiers and was mapped to Nebraska. The 51 jurisdictions contain 17832 age/sex-counted rape arrests; race and ethnicity subtotals differ and are preserved rather than forced to reconcile. Current dynamic files can differ from an earlier annual publication or archive snapshot.
Recorded arrests per 100,000 group residents
| State | White | Black | AIAN | Asian/PI | Hispanic, any race | Non-Hispanic, any race |
|---|---|---|---|---|---|---|
| Alabama | 3.19 | 6.14 | 0.00 | 1.04* | 5.78* | 3.10 |
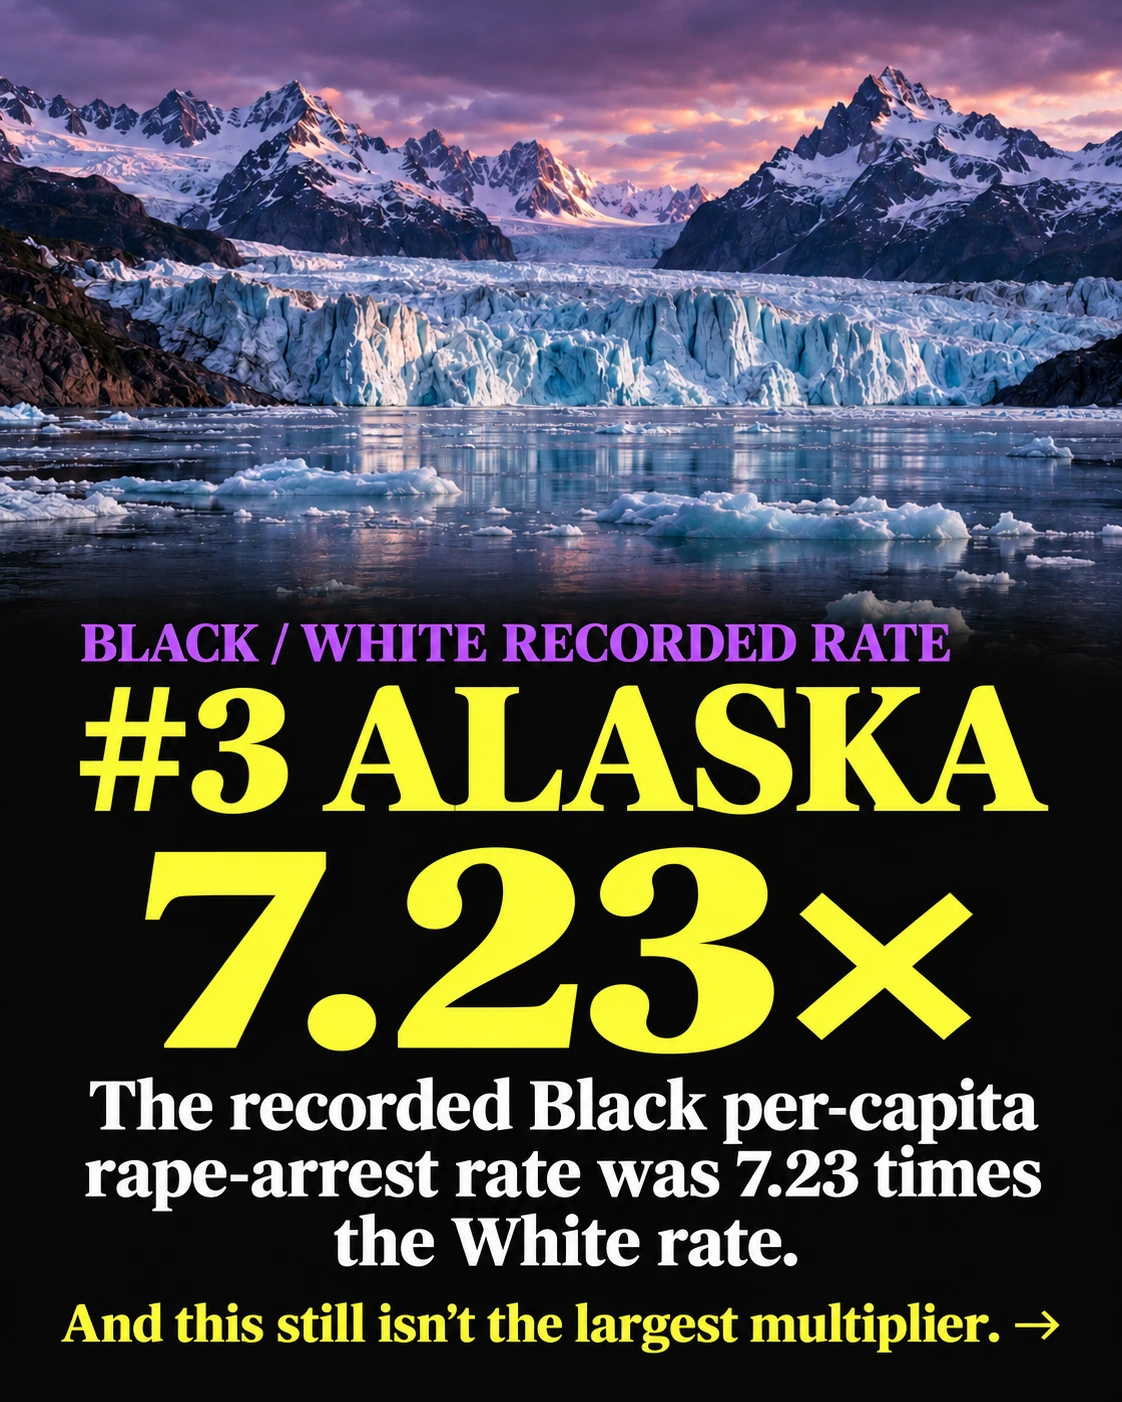
| Alaska | 5.51 | 39.85* | 41.04 | 12.27* | 1.75* | 6.74 |
| Arizona | 3.36 | 16.92 | 9.76 | 1.39* | 4.60 | 3.73 |
| Arkansas | 8.32 | 21.44 | 0.00 | 7.73* | 14.55 | 8.24 |
| California | 4.24 | 8.51 | 2.09* | 1.00 | 4.24 | 2.21 |
| Colorado | 6.21 | 19.95 | 3.91* | 4.26* | 9.62 | 4.79 |
| Connecticut | 2.68 | 11.83 | 0.00 | 0.97* | 5.38 | 3.23 |
| Delaware | 4.12 | 11.79 | 0.00 | 0.00 | 11.40* | 4.74 |
| District of Columbia | 2.74* | 12.15 | 175.58* | 0.00 | 10.18* | 5.70 |
| Florida | 2.09 | 5.14 | 0.00 | 0.61* | 2.86 | 1.93 |
| Georgia | 3.57 | 5.05 | 1.35* | 1.51* | 5.78 | 3.00 |
| Hawaii | 10.77 | 31.56* | 0.00 | 8.67 | 6.76* | 7.63 |
| Idaho | 7.05 | 40.79* | 5.75* | 2.34* | 8.74 | 5.89 |
| Illinois | 1.73 | 3.68 | 0.00 | 0.34* | 2.60 | 1.28 |
| Indiana | 3.14 | 11.55 | 0.00 | 0.45* | 5.39 | 3.00 |
| Iowa | 6.83 | 35.07 | 17.80* | 1.89* | 10.19 | 7.10 |
| Kansas | 4.30 | 17.25 | 2.53* | 2.82* | 8.76 | 4.08 |
| Kentucky | 4.63 | 14.39 | 5.72* | 1.98* | 7.72 | 5.20 |
| Louisiana | 4.26 | 6.34 | 0.00 | 2.05* | 7.26 | 3.94 |
| Maine | 3.89 | 17.21* | 0.00 | 0.00 | 2.97* | 3.28 |
| Maryland | 5.60 | 11.08 | 5.25* | 2.14* | 13.96 | 4.40 |
| Massachusetts | 3.46 | 11.71 | 0.00 | 0.50* | 7.19 | 3.05 |
| Michigan | 6.07 | 18.44 | 11.65* | 1.94* | 4.81 | 1.64 |
| Minnesota | 5.67 | 29.38 | 20.19* | 4.14* | 20.00 | 3.89 |
| Mississippi | 2.49 | 2.25 | 0.00 | 2.50* | 4.13* | 1.56 |
| Missouri | 4.98 | 21.84 | 2.45* | 1.75* | 10.27 | 5.87 |
| Montana | 5.06 | 13.24* | 21.98* | 0.00 | 8.94* | 5.46 |
| Nebraska | 8.64 | 20.97 | 19.40* | 4.59* | 13.59 | 5.77 |
| Nevada | 7.22 | 24.39 | 6.98* | 2.73* | 11.11 | 6.97 |
| New Hampshire | 4.23 | 26.41* | 21.46* | 0.00 | 18.33* | 3.74 |
| New Jersey | 2.33 | 5.20 | 0.00 | 0.56* | 4.44 | 1.80 |
| New Mexico | 1.75 | 3.23* | 3.71* | 2.03* | 2.01 | 1.66* |
| New York | 4.07 | 15.82 | 5.20* | 3.69 | 11.39 | 5.34 |
| North Carolina | 1.54 | 3.26 | 2.21* | 0.00 | 2.71 | 1.38 |
| North Dakota | 3.22 | 46.90* | 16.64* | 10.78* | 14.68* | 5.43 |
| Ohio | 2.24 | 9.50 | 0.00 | 1.07* | 3.25 | 0.81 |
| Oklahoma | 4.31 | 15.38 | 3.58* | 1.61* | 7.80 | 3.19 |
| Oregon | 5.35 | 13.06* | 0.00 | 1.55* | 7.85 | 1.63 |
| Pennsylvania | 4.44 | 15.87 | 0.00 | 2.51* | 8.91 | 5.18 |
| Rhode Island | 5.62 | 14.18* | 6.38* | 2.10* | 10.53 | 5.09 |
| South Carolina | 5.61 | 11.51 | 0.00 | 1.59* | 11.93 | 6.17 |
| South Dakota | 3.22 | 8.13* | 19.06* | 0.00 | 9.99* | 3.09 |
| Tennessee | 4.64 | 8.59 | 0.00 | 2.87* | 9.86 | 4.65 |
| Texas | 5.98 | 11.31 | 1.12* | 2.09 | 7.31 | 5.17 |
| Utah | 12.06 | 73.98 | 17.60* | 7.90* | 10.13 | 4.40 |
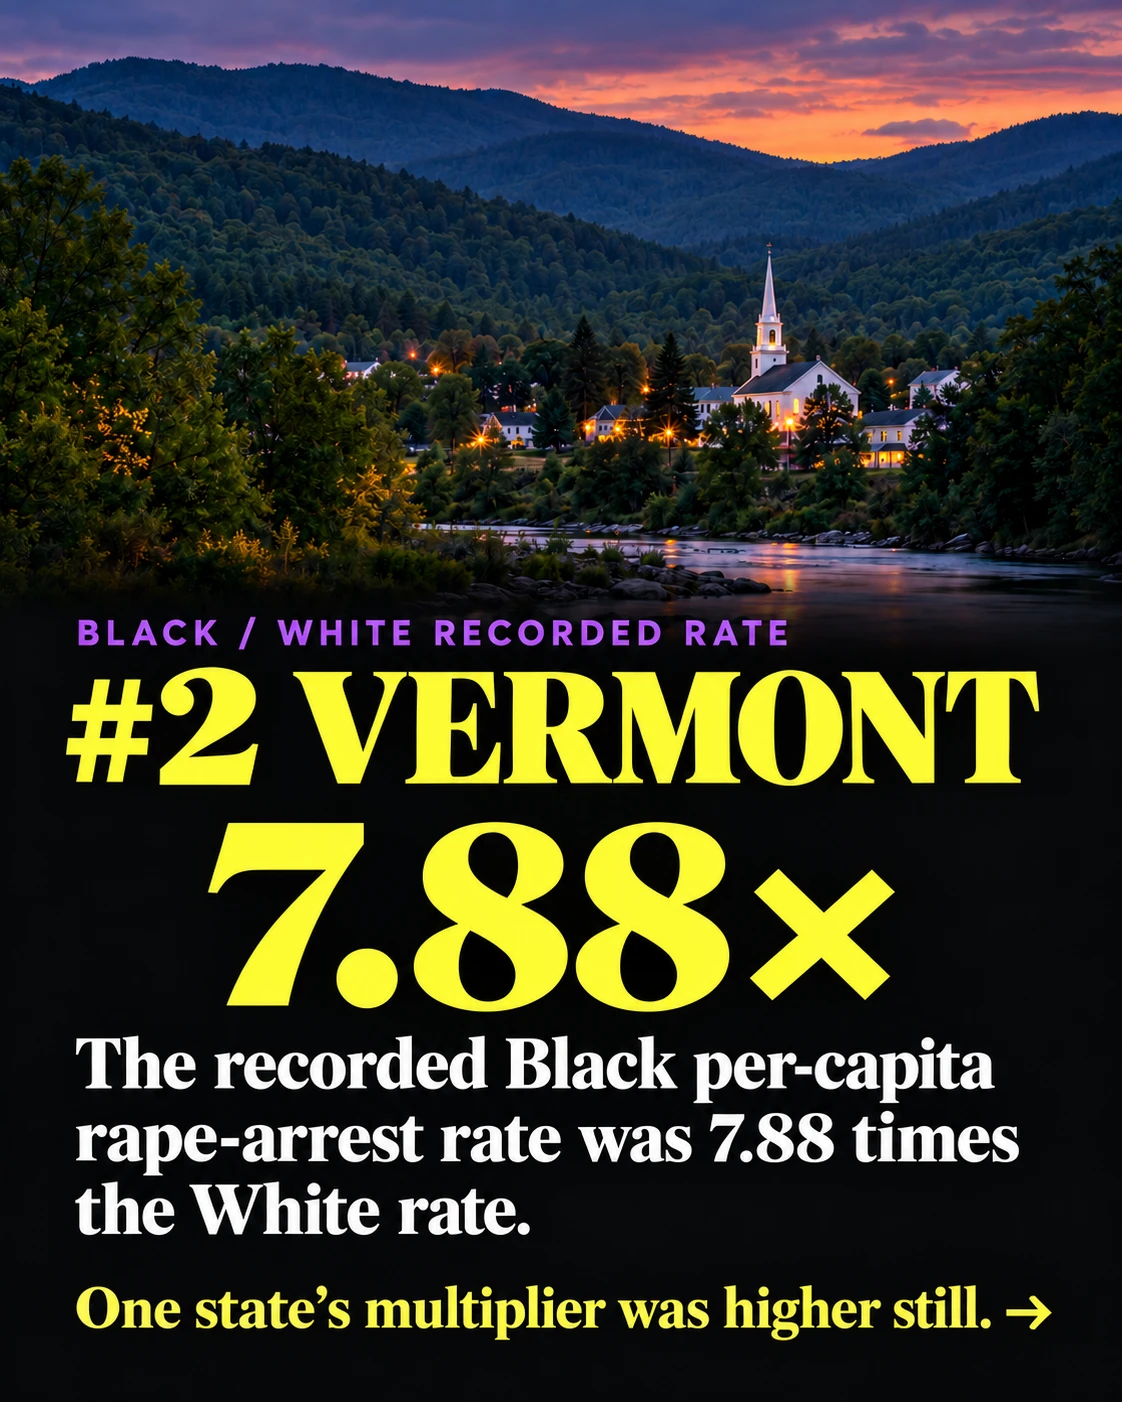
| Vermont | 11.25 | 88.68* | 0.00 | 6.52* | 11.49* | 8.24 |
| Virginia | 5.16 | 9.32 | 0.00 | 1.31* | 9.98 | 4.80 |
| Washington | 6.52 | 19.98 | 8.56* | 2.13 | 9.96 | 3.44 |
| West Virginia | 4.27 | 15.98* | 18.62* | 5.43* | 0.00 | 2.32 |
| Wisconsin | 10.83 | 59.87 | 32.28 | 7.46* | 25.39 | 10.05 |
| Wyoming | 7.02 | 0.00 | 0.00 | 0.00 | 9.23* | 5.55 |
Underlying recorded arrest counts
| State | White | Black | AIAN | Asian/PI | Hispanic | Non-Hispanic | Age/sex total |
|---|---|---|---|---|---|---|---|
| Alabama | 113 | 84 | 0 | 1 | 18 | 150 | 203 |
| Alaska | 26 | 11 | 47 | 8 | 1 | 46 | 93 |
| Arizona | 206 | 75 | 38 | 5 | 112 | 192 | 331 |
| Arkansas | 201 | 103 | 0 | 6 | 43 | 230 | 316 |
| California | 1167 | 215 | 15 | 69 | 681 | 517 | 1511 |
| Colorado | 316 | 59 | 4 | 11 | 133 | 219 | 390 |
| Connecticut | 76 | 58 | 0 | 2 | 38 | 96 | 139 |
| Delaware | 29 | 30 | 0 | 0 | 14 | 44 | 59 |
| District of Columbia | 9 | 37 | 9 | 0 | 9 | 35 | 58 |
| Florida | 373 | 203 | 0 | 5 | 192 | 321 | 586 |
| Georgia | 233 | 187 | 1 | 9 | 75 | 296 | 437 |
| Hawaii | 39 | 10 | 0 | 60 | 10 | 99 | 111 |
| Idaho | 130 | 9 | 2 | 1 | 25 | 101 | 143 |
| Illinois | 166 | 68 | 0 | 3 | 64 | 131 | 246 |
| Indiana | 181 | 85 | 0 | 1 | 34 | 189 | 270 |
| Iowa | 197 | 54 | 4 | 2 | 26 | 212 | 264 |
| Kansas | 109 | 32 | 1 | 3 | 37 | 104 | 145 |
| Kentucky | 183 | 59 | 1 | 2 | 20 | 225 | 251 |
| Louisiana | 122 | 95 | 0 | 2 | 26 | 167 | 222 |
| Maine | 51 | 6 | 0 | 0 | 1 | 45 | 62 |
| Maryland | 199 | 219 | 3 | 10 | 116 | 239 | 443 |
| Massachusetts | 193 | 83 | 0 | 3 | 72 | 187 | 293 |
| Michigan | 481 | 263 | 9 | 8 | 30 | 156 | 791 |
| Minnesota | 268 | 140 | 17 | 14 | 78 | 210 | 537 |
| Mississippi | 43 | 25 | 0 | 1 | 5 | 44 | 72 |
| Missouri | 255 | 160 | 1 | 3 | 36 | 346 | 422 |
| Montana | 51 | 1 | 16 | 0 | 5 | 59 | 72 |
| Nebraska | 150 | 24 | 7 | 3 | 37 | 100 | 190 |
| Nevada | 167 | 88 | 4 | 10 | 111 | 158 | 288 |
| New Hampshire | 55 | 8 | 1 | 0 | 13 | 50 | 66 |
| New Jersey | 154 | 77 | 0 | 6 | 99 | 131 | 240 |
| New Mexico | 30 | 2 | 9 | 1 | 21 | 18 | 46 |
| New York | 549 | 559 | 12 | 75 | 458 | 846 | 1322 |
| North Carolina | 118 | 79 | 4 | 0 | 36 | 134 | 203 |
| North Dakota | 22 | 15 | 7 | 2 | 6 | 41 | 48 |
| Ohio | 213 | 153 | 0 | 4 | 20 | 91 | 393 |
| Oklahoma | 128 | 50 | 14 | 2 | 43 | 113 | 197 |
| Oregon | 194 | 14 | 0 | 4 | 52 | 59 | 224 |
| Pennsylvania | 464 | 257 | 0 | 15 | 110 | 613 | 737 |
| Rhode Island | 51 | 15 | 1 | 1 | 22 | 46 | 68 |
| South Carolina | 212 | 162 | 0 | 2 | 52 | 311 | 379 |
| South Dakota | 25 | 2 | 15 | 0 | 5 | 27 | 43 |
| Tennessee | 262 | 102 | 0 | 5 | 57 | 309 | 372 |
| Texas | 1425 | 485 | 4 | 43 | 921 | 967 | 1967 |
| Utah | 377 | 45 | 10 | 12 | 60 | 128 | 462 |
| Vermont | 68 | 10 | 0 | 1 | 2 | 52 | 79 |
| Virginia | 309 | 164 | 0 | 9 | 102 | 374 | 499 |
| Washington | 391 | 76 | 14 | 21 | 119 | 233 | 540 |
| West Virginia | 70 | 11 | 1 | 1 | 0 | 40 | 102 |
| Wisconsin | 556 | 239 | 24 | 16 | 127 | 549 | 862 |
| Wyoming | 38 | 0 | 0 | 0 | 6 | 29 | 38 |
Population denominators
| State | White alone | Black alone | AIAN alone | Asian+NHPI alone | Hispanic, all races | Non-Hispanic, all races |
|---|---|---|---|---|---|---|
| Alabama | 3,545,537 | 1,368,358 | 40,544 | 96,051 | 311,447 | 4,846,252 |
| Alaska | 471,980 | 27,605 | 114,527 | 65,207 | 57,226 | 682,907 |
| Arizona | 6,137,861 | 443,135 | 389,519 | 358,931 | 2,435,663 | 5,146,721 |
| Arkansas | 2,415,105 | 480,352 | 36,414 | 77,658 | 295,575 | 2,792,779 |
| California | 27,538,266 | 2,527,183 | 716,157 | 6,920,819 | 16,069,215 | 23,362,048 |
| Colorado | 5,088,948 | 295,736 | 102,358 | 257,988 | 1,382,939 | 4,574,554 |
| Connecticut | 2,840,852 | 490,303 | 31,611 | 205,533 | 706,806 | 2,968,263 |
| Delaware | 703,988 | 254,378 | 8,828 | 51,381 | 122,813 | 929,104 |
| District of Columbia | 328,752 | 304,452 | 5,126 | 39,800 | 88,430 | 613,820 |
| Florida | 17,857,063 | 3,949,147 | 147,839 | 824,035 | 6,707,753 | 16,664,462 |
| Georgia | 6,519,858 | 3,703,855 | 74,328 | 595,659 | 1,298,399 | 9,882,479 |
| Hawaii | 362,285 | 31,690 | 5,767 | 692,178 | 147,897 | 1,298,249 |
| Idaho | 1,843,921 | 22,063 | 34,784 | 42,772 | 286,193 | 1,715,426 |
| Illinois | 9,599,046 | 1,848,198 | 87,698 | 874,231 | 2,464,090 | 10,246,068 |
| Indiana | 5,759,679 | 735,661 | 34,219 | 220,456 | 631,014 | 6,293,261 |
| Iowa | 2,884,435 | 153,983 | 22,468 | 105,733 | 255,125 | 2,986,363 |
| Kansas | 2,537,393 | 185,502 | 39,586 | 106,550 | 422,449 | 2,548,157 |
| Kentucky | 3,949,272 | 409,870 | 17,474 | 101,123 | 259,223 | 4,329,149 |
| Louisiana | 2,864,437 | 1,498,009 | 45,291 | 97,762 | 358,082 | 4,239,658 |
| Maine | 1,310,140 | 34,870 | 9,993 | 21,219 | 33,633 | 1,371,379 |
| Maryland | 3,551,301 | 1,976,758 | 57,175 | 466,677 | 830,949 | 5,432,271 |
| Massachusetts | 5,572,524 | 708,951 | 43,304 | 599,377 | 1,001,329 | 6,134,842 |
| Michigan | 7,930,610 | 1,426,504 | 77,228 | 412,983 | 623,879 | 9,516,580 |
| Minnesota | 4,723,898 | 476,525 | 84,204 | 338,354 | 390,085 | 5,403,066 |
| Mississippi | 1,725,681 | 1,110,314 | 20,113 | 40,061 | 120,945 | 2,822,100 |
| Missouri | 5,125,212 | 732,670 | 40,832 | 171,423 | 350,437 | 5,895,029 |
| Montana | 1,008,299 | 7,554 | 72,778 | 12,898 | 55,956 | 1,081,277 |
| Nebraska | 1,735,119 | 114,430 | 36,090 | 65,310 | 272,255 | 1,733,210 |
| Nevada | 2,311,790 | 360,756 | 57,272 | 366,009 | 999,427 | 2,268,040 |
| New Hampshire | 1,300,268 | 30,287 | 4,660 | 46,167 | 70,912 | 1,338,120 |
| New Jersey | 6,612,719 | 1,481,943 | 87,822 | 1,071,728 | 2,229,461 | 7,271,390 |
| New Mexico | 1,715,139 | 61,889 | 242,732 | 49,173 | 1,046,254 | 1,084,002 |
| New York | 13,484,281 | 3,534,129 | 230,696 | 2,034,154 | 4,019,838 | 15,847,410 |
| North Carolina | 7,677,270 | 2,425,031 | 180,842 | 459,088 | 1,327,268 | 9,718,756 |
| North Dakota | 682,429 | 31,985 | 42,075 | 18,545 | 40,877 | 755,691 |
| Ohio | 9,521,458 | 1,610,713 | 41,736 | 373,060 | 614,689 | 11,268,615 |
| Oklahoma | 2,973,266 | 325,186 | 391,203 | 124,531 | 551,224 | 3,544,169 |
| Oregon | 3,628,147 | 107,235 | 88,430 | 257,574 | 662,739 | 3,609,632 |
| Pennsylvania | 10,460,297 | 1,619,718 | 69,611 | 598,435 | 1,234,581 | 11,844,170 |
| Rhode Island | 907,310 | 105,806 | 15,682 | 47,665 | 208,976 | 903,332 |
| South Carolina | 3,780,966 | 1,407,815 | 36,033 | 125,594 | 435,995 | 5,042,836 |
| South Dakota | 777,547 | 24,589 | 78,686 | 17,722 | 50,059 | 874,610 |
| Tennessee | 5,649,772 | 1,187,324 | 44,974 | 174,128 | 577,903 | 6,649,847 |
| Texas | 23,840,793 | 4,288,977 | 357,871 | 2,058,452 | 12,602,294 | 18,688,537 |
| Utah | 3,125,961 | 60,830 | 56,809 | 151,876 | 592,413 | 2,911,200 |
| Vermont | 604,630 | 11,277 | 2,628 | 15,338 | 17,401 | 631,092 |
| Virginia | 5,987,047 | 1,759,626 | 57,593 | 688,166 | 1,021,625 | 7,789,570 |
| Washington | 5,997,386 | 380,439 | 163,476 | 984,080 | 1,194,521 | 6,763,659 |
| West Virginia | 1,638,139 | 68,826 | 5,370 | 18,409 | 42,592 | 1,727,387 |
| Wisconsin | 5,132,525 | 399,186 | 74,341 | 214,532 | 500,269 | 5,460,706 |
| Wyoming | 540,996 | 7,223 | 16,501 | 8,125 | 65,028 | 522,590 |
Multiplier ranking for revised carousel
Black recorded rate divided by White recorded rate, computed from original counts and denominators before rounding. DC excluded. These are ratios of recorded rates, not coverage-adjusted statewide estimates.
| Rank | State | Black / White rate |
|---|---|---|
| 1 | North Dakota | 14.55x |
| 2 | Vermont | 7.88x |
| 3 | Alaska | 7.23x |
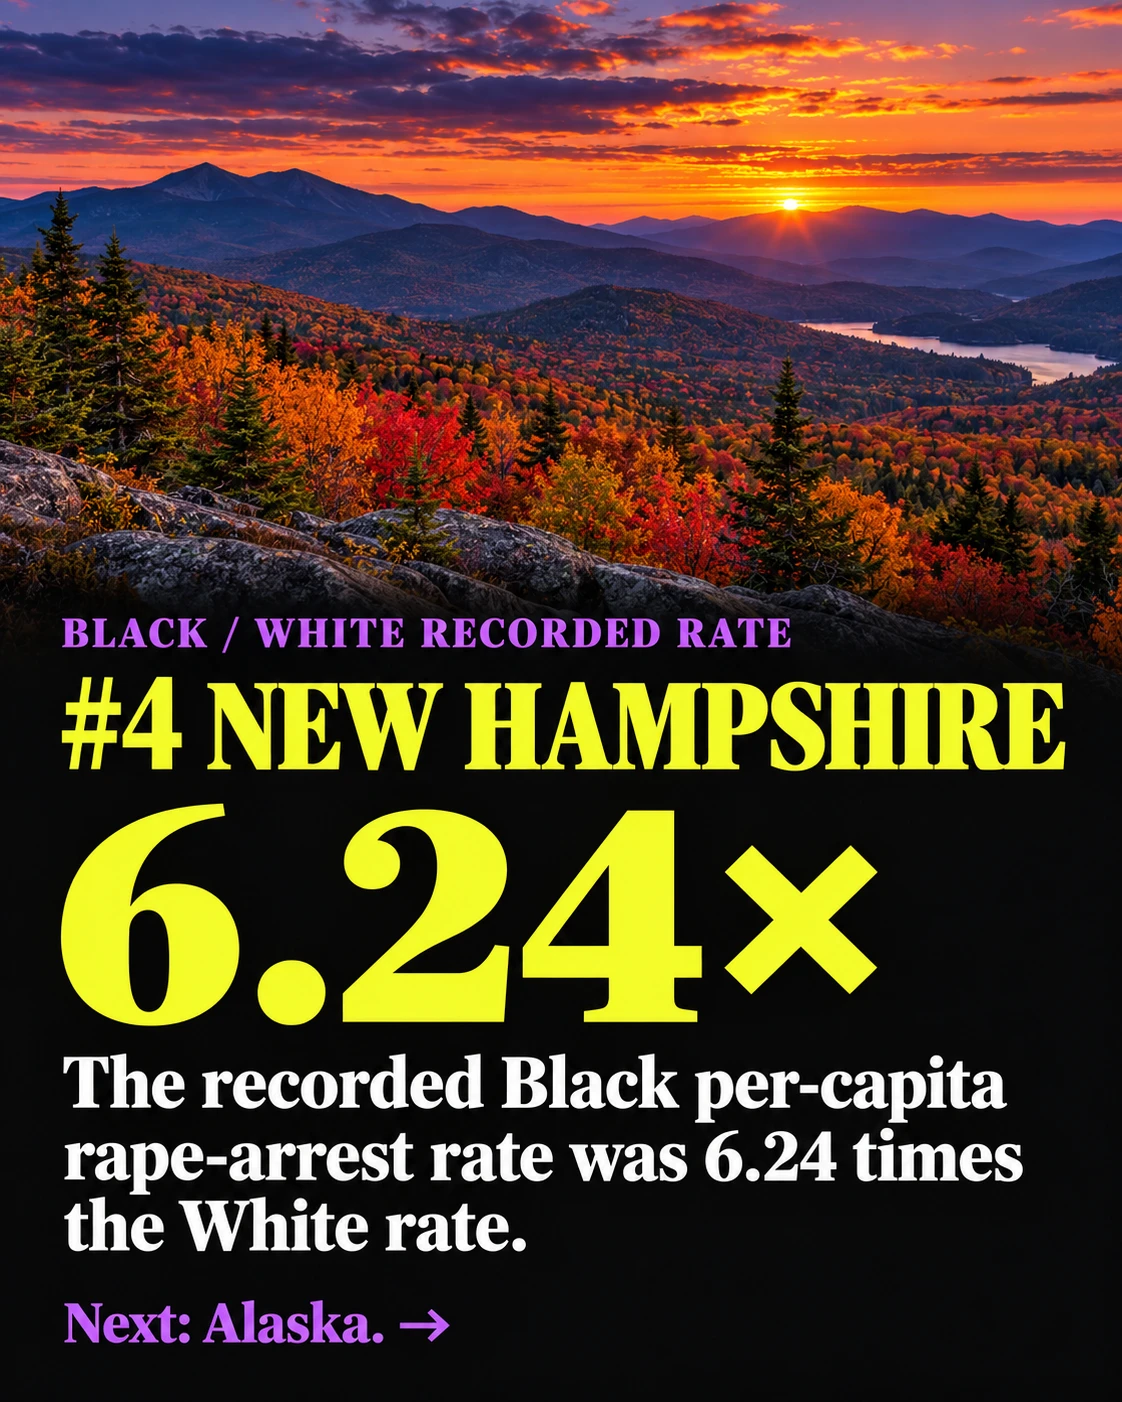
| 4 | New Hampshire | 6.24x |
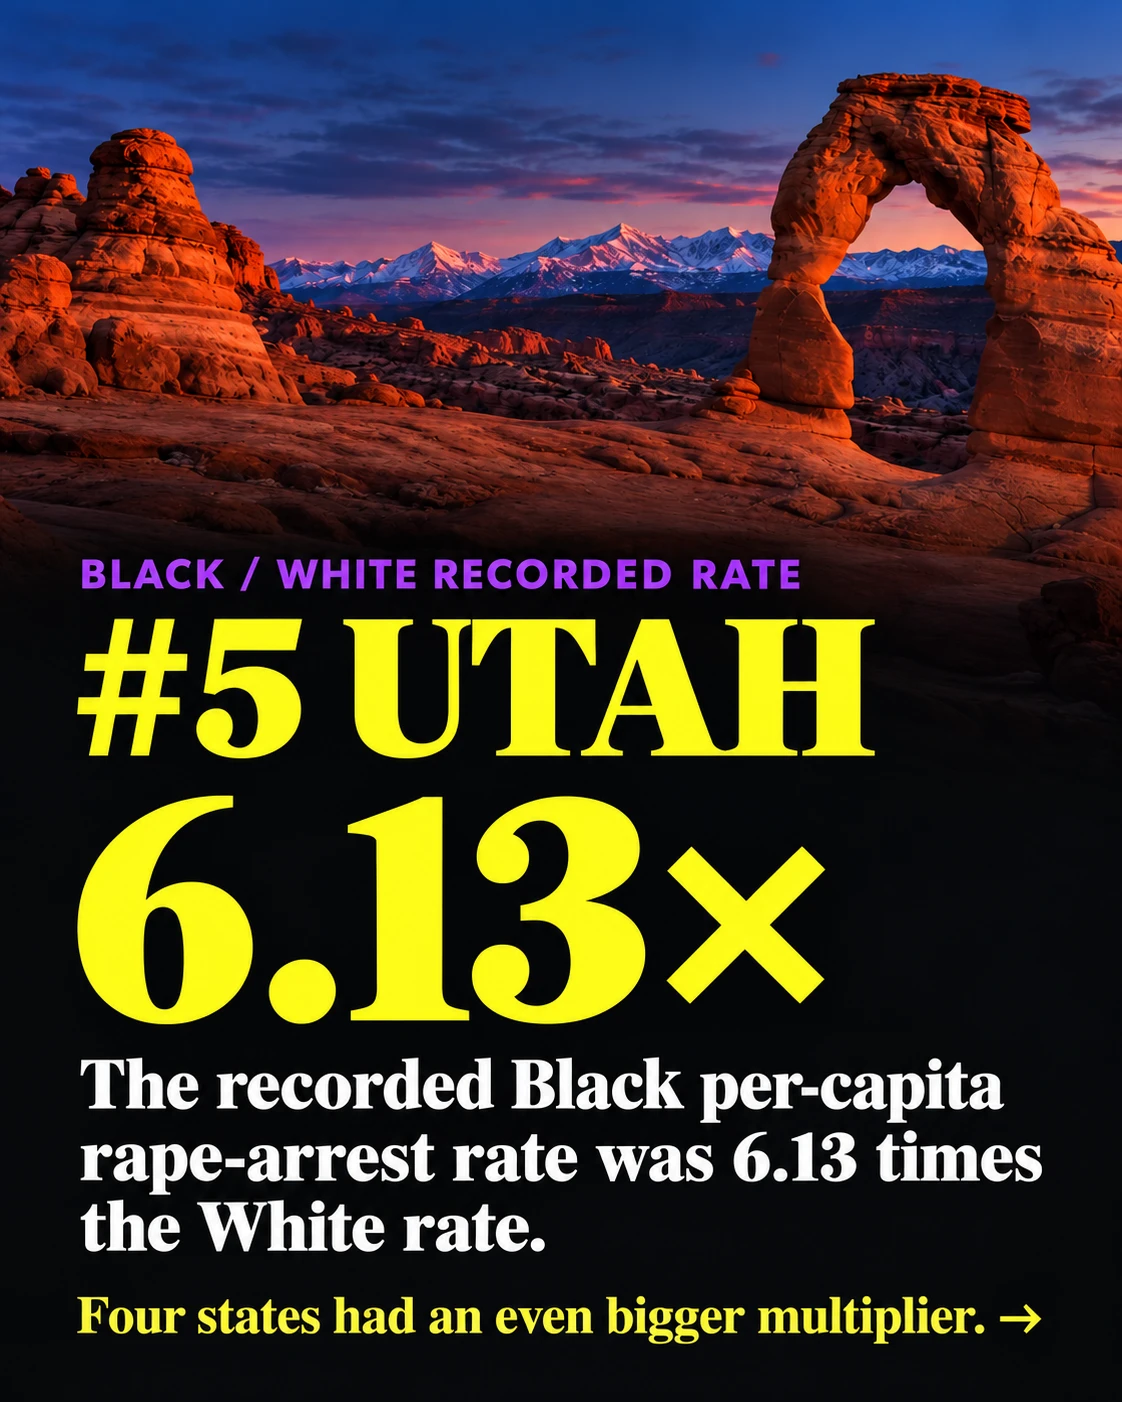
| 5 | Utah | 6.13x |
| 6 | Idaho | 5.79x |
| 7 | Wisconsin | 5.53x |
| 8 | Minnesota | 5.18x |
| 9 | Iowa | 5.13x |
| 10 | Arizona | 5.04x |
| 11 | Connecticut | 4.42x |
| 12 | Maine | 4.42x |
| 13 | Missouri | 4.39x |
| 14 | Ohio | 4.25x |
| 15 | Kansas | 4.02x |
| 16 | New York | 3.88x |
| 17 | West Virginia | 3.74x |
| 18 | Indiana | 3.68x |
| 19 | Pennsylvania | 3.58x |
| 20 | Oklahoma | 3.57x |
| 21 | Massachusetts | 3.38x |
| 22 | Nevada | 3.38x |
| 23 | Colorado | 3.21x |
| 24 | Kentucky | 3.11x |
| 25 | Washington | 3.06x |
| 26 | Michigan | 3.04x |
| 27 | Hawaii | 2.93x |
| 28 | Delaware | 2.86x |
| 29 | Montana | 2.62x |
| 30 | Arkansas | 2.58x |
| 31 | South Dakota | 2.53x |
| 32 | Rhode Island | 2.52x |
| 33 | Florida | 2.46x |
| 34 | Oregon | 2.44x |
| 35 | Nebraska | 2.43x |
| 36 | New Jersey | 2.23x |
| 37 | Illinois | 2.13x |
| 38 | North Carolina | 2.12x |
| 39 | South Carolina | 2.05x |
| 40 | California | 2.01x |
| 41 | Maryland | 1.98x |
| 42 | Alabama | 1.93x |
| 43 | Texas | 1.89x |
| 44 | Tennessee | 1.85x |
| 45 | New Mexico | 1.85x |
| 46 | Virginia | 1.81x |
| 47 | Louisiana | 1.49x |
| 48 | Georgia | 1.41x |
| 49 | Mississippi | 0.90x |
| 50 | Wyoming | 0.00x |
The original nine-slide carousel
Visuals and interpretation
The carousel’s chalkboard maps, scenery and dog imagery are illustrative compositions made with an image-generation tool. They are not photographs documenting the arrests. The commentary is mine; the tables describe recorded events and do not establish an individual’s conduct or a racial explanation for offending.
More research
Browse my research topics, send a correction or source suggestion, or support my independent work.