

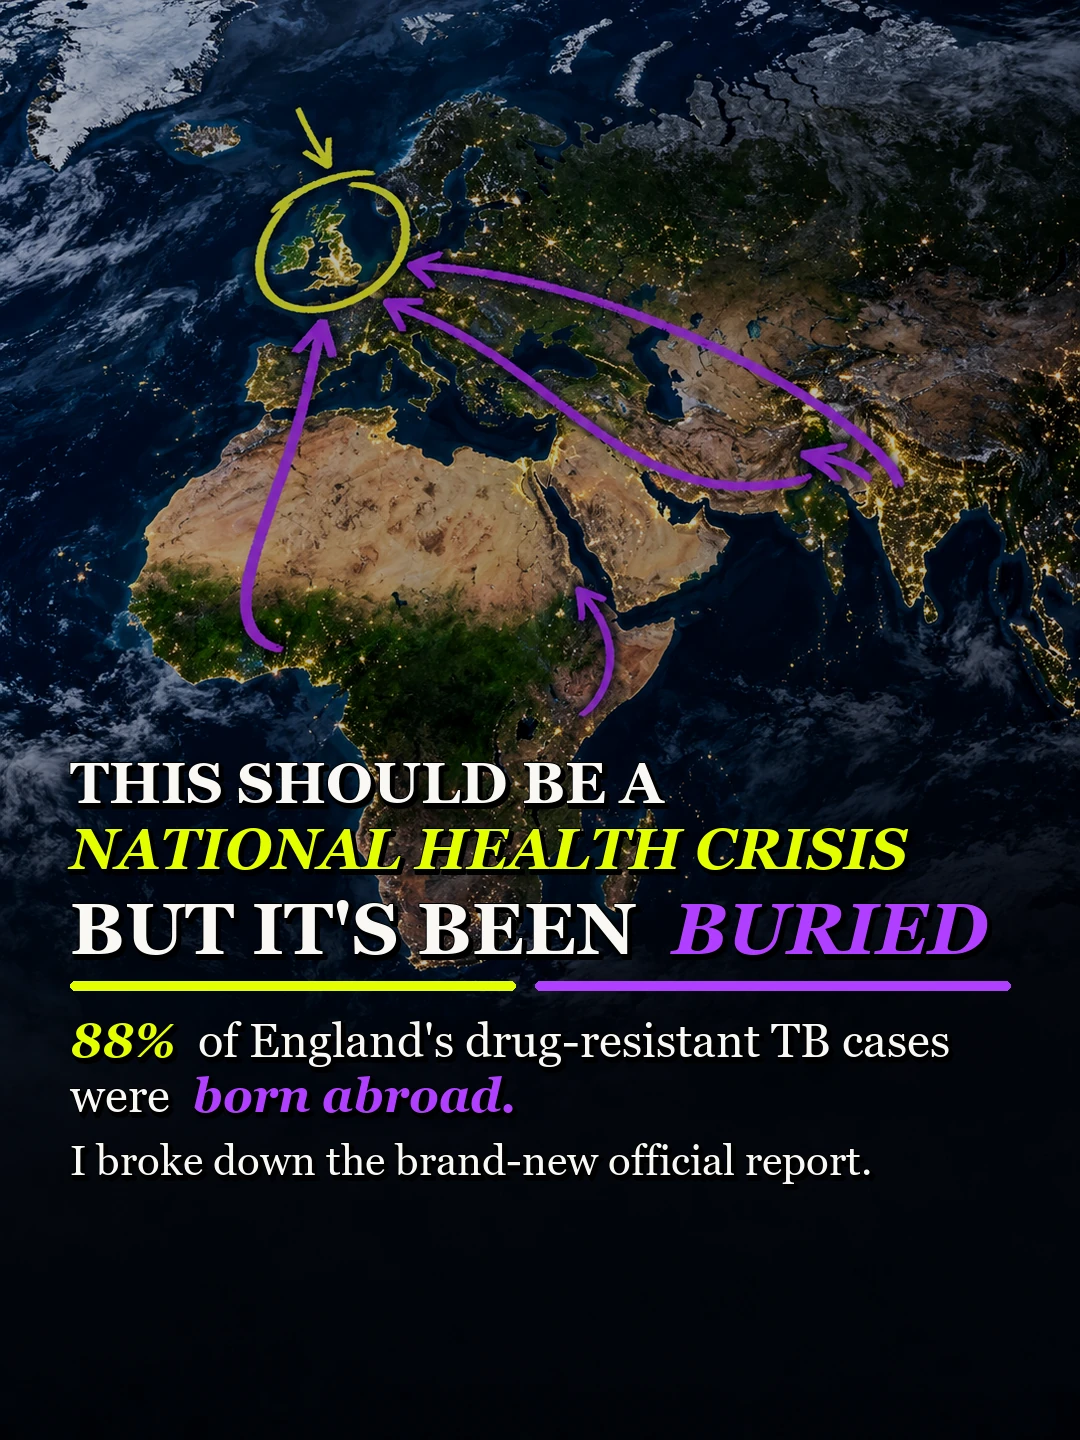
A new UKHSA report records a 22.4-fold difference in TB notification rates between non-UK-born and UK-born people in England. It also identifies gaps in latent-TB testing and reports that 60 of 68 culture-confirmed multidrug- or rifampicin-resistant cases were among people born abroad. I examined the sources and calculations behind the figures.
By Doggy. Adapted from my original Instagram carousel, posted 30 October 2026. The government report was published on 29 October and primarily describes 2025 data.
The notification-rate comparison
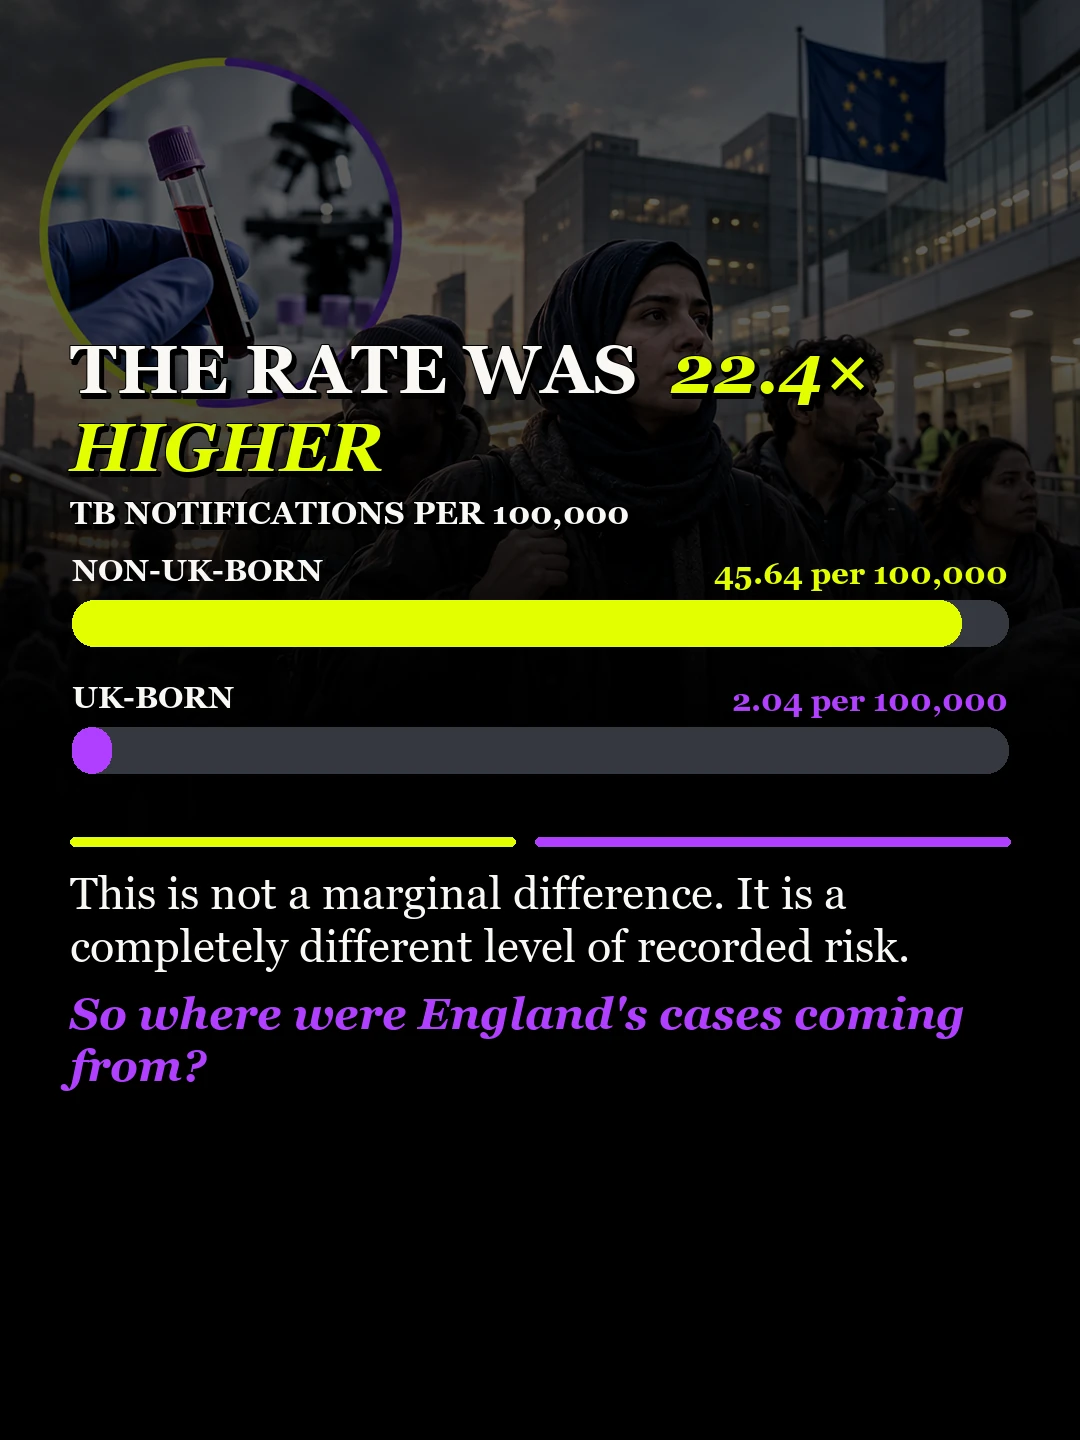
UKHSA reports 45.64 notifications per 100,000 non-UK-born residents and 2.04 per 100,000 UK-born residents. 45.64 ÷ 2.04 = 22.37, rounded to 22.4 times. These are annual notification rates, not the proportion of either population living with TB.
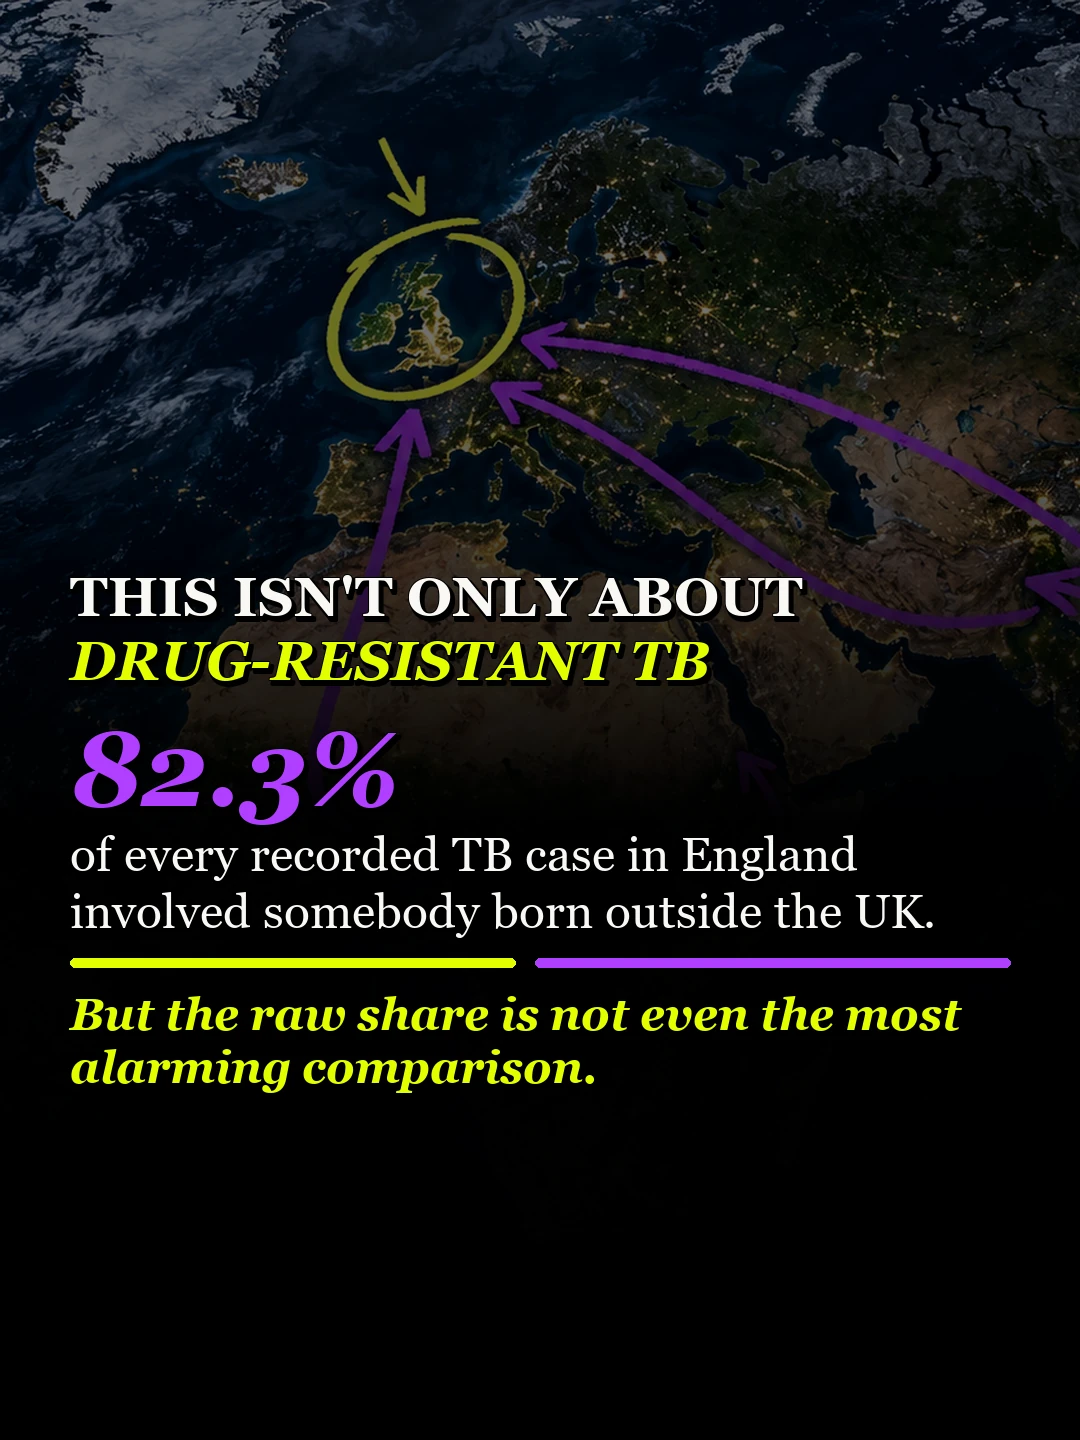
Among notifications with known birthplace, 82.3% involved non-UK-born people. “Non-UK-born” identifies birthplace, not current citizenship, ethnicity, religion or immigration status. It also does not establish where someone acquired the infection.
Country-of-birth shares
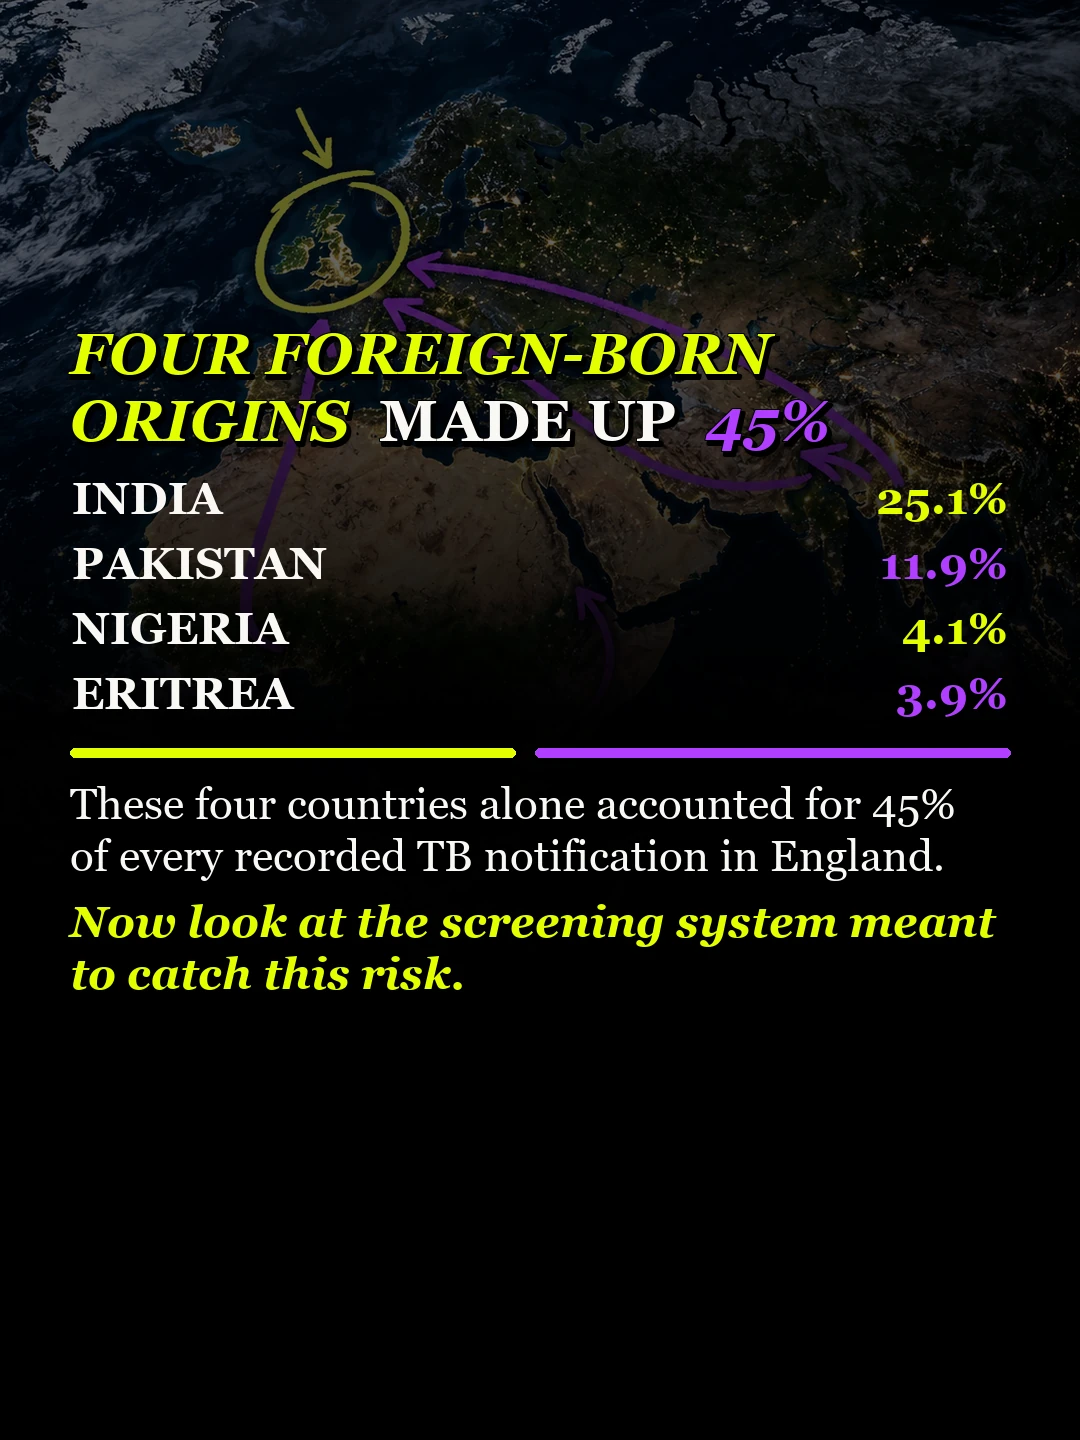
The report lists India at 25.1%, Pakistan at 11.9%, Nigeria at 4.1% and Eritrea at 3.9%. Their rounded shares add to 25.1 + 11.9 + 4.1 + 3.9 = 45.0%. These are shares of recorded notifications, not infection rates for everyone from those countries.
For national context, England recorded 5,449 notifications in 2025, similar to 5,485 in 2024. The overall rate was 9.26 per 100,000. The headline disparities should therefore not be read as evidence that overall notifications surged in 2025.
Exactly what the 88.2% figure measures
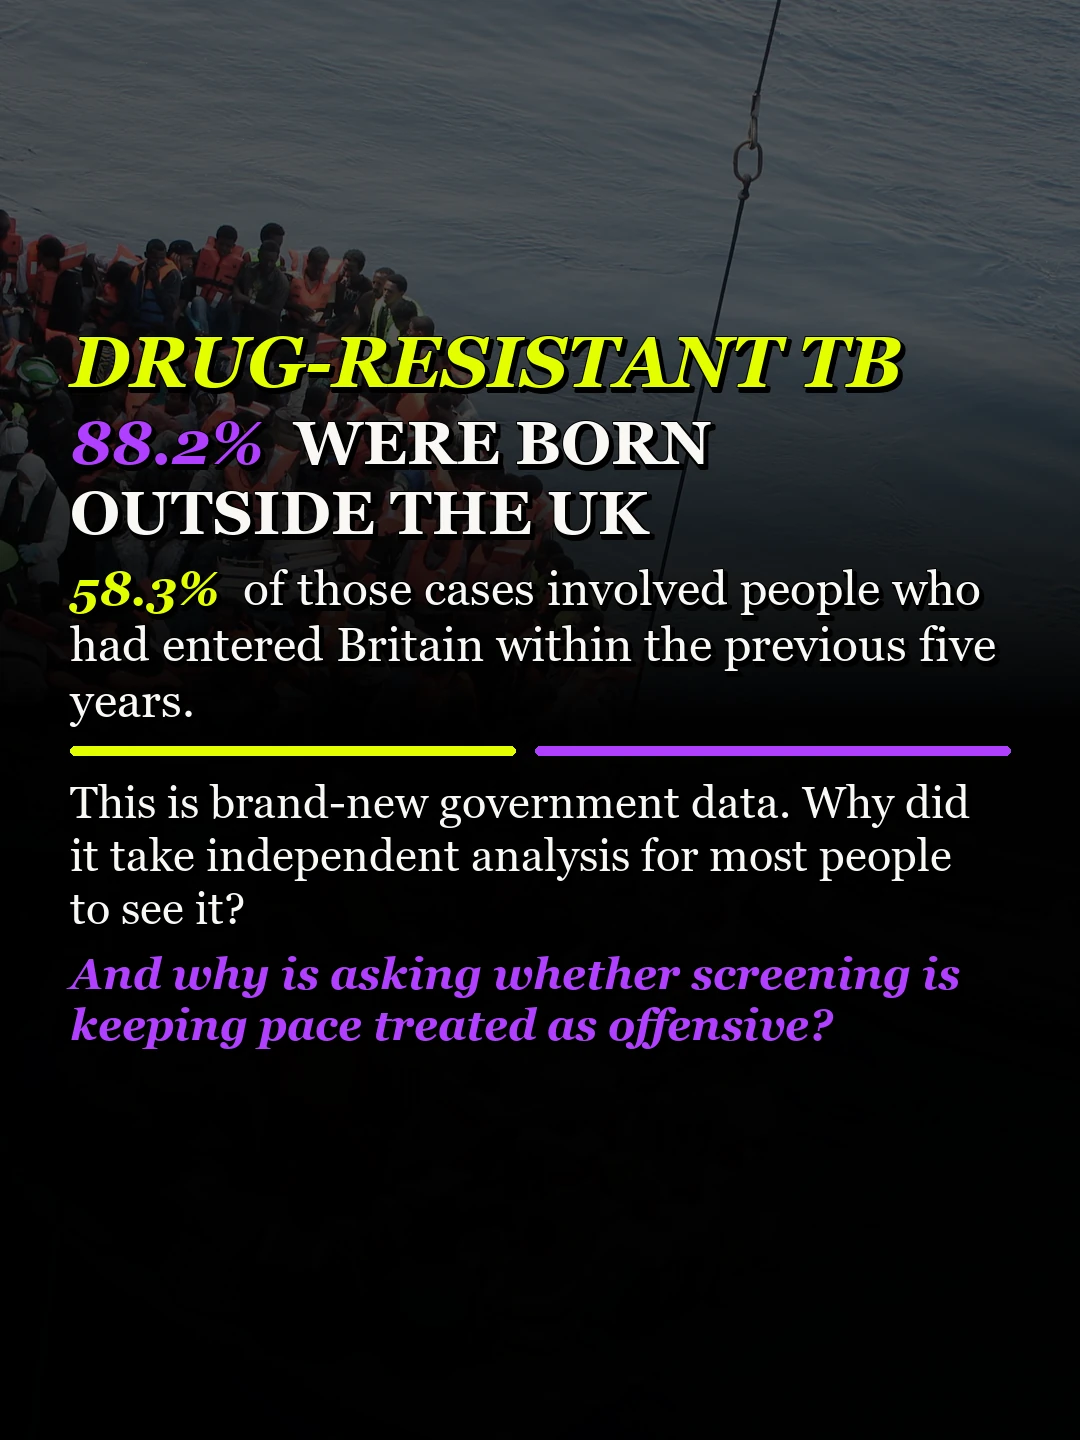
The relevant category is culture-confirmed multidrug-resistant or rifampicin-resistant TB, abbreviated MDR/RR-TB. Of 68 cases, 60 were non-UK-born: 60 ÷ 68 × 100 = 88.24%, rounded to 88.2%. This is not a statistic covering every form of drug resistance or every TB notification.
Among those 60 people, 58.3% had entered the UK within five years. That is a share of this particular subgroup, not of all people born abroad. UKHSA also describes a wider group of 95 people treated as having MDR/RR-TB, which can include cases without culture confirmation. The 68-case denominator should not be confused with that treatment group.
The latent-TB testing gap
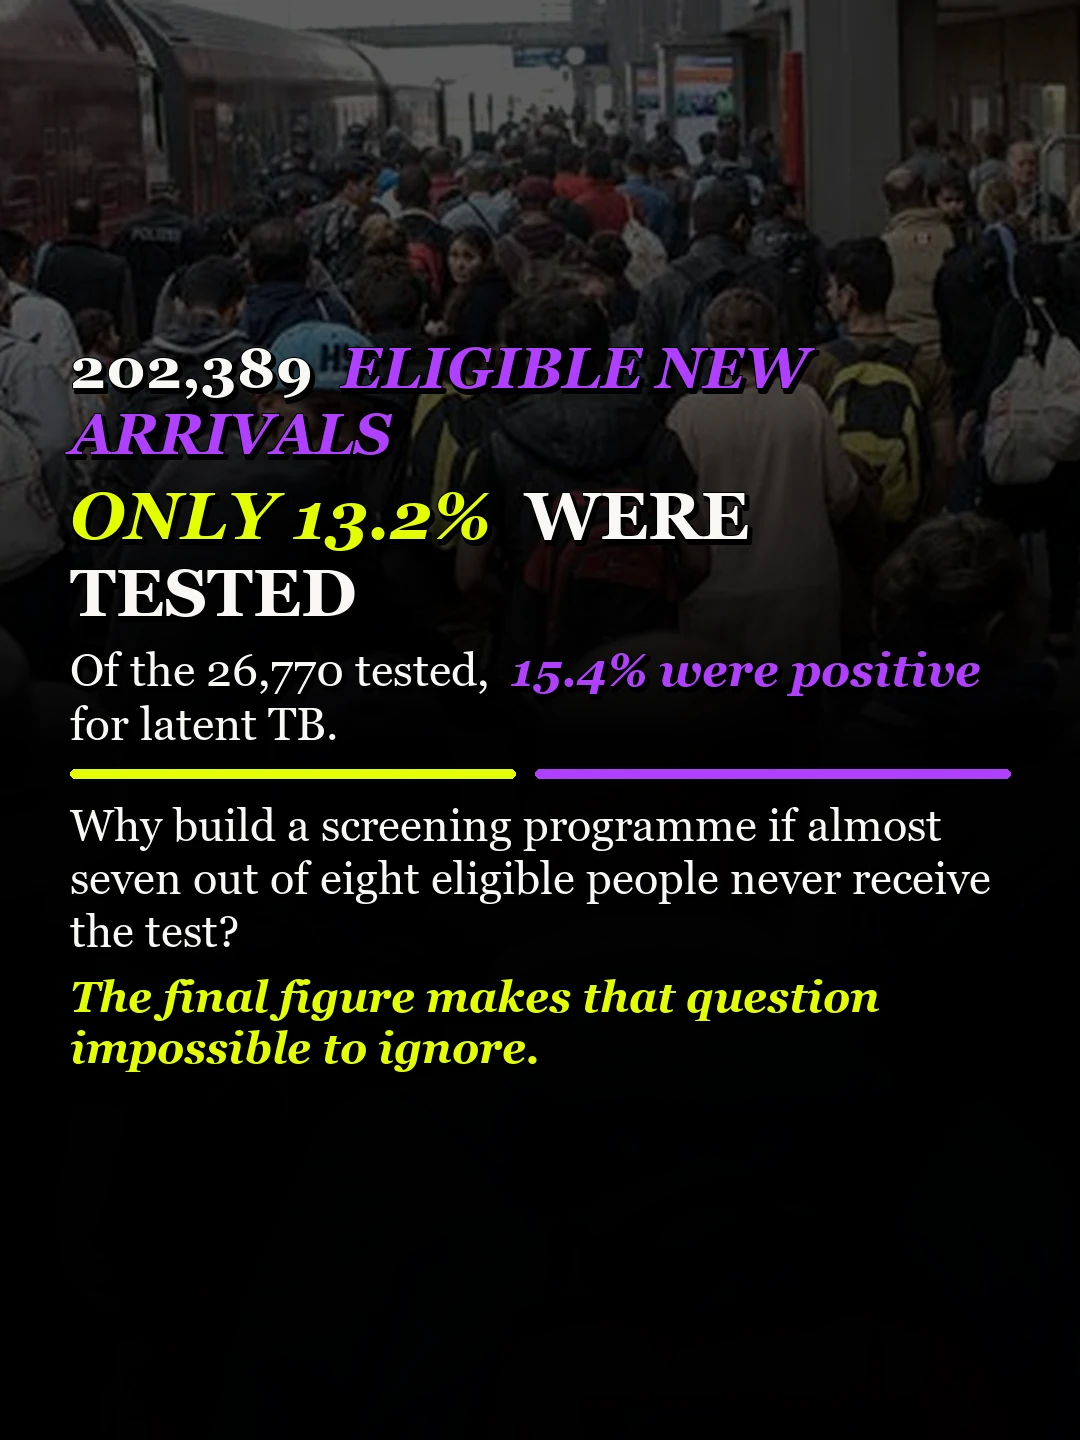
The NHS England programme identified 202,389 eligible migrants in 2025; 26,770 were tested. The calculation is 26,770 ÷ 202,389 × 100 = 13.23%, reported as 13.2%. UKHSA gives 17.0% when also including tests in people whose eligibility could not be verified. Eligibility for this targeted programme is not the same as the total number of arrivals.
Of those tested, 15.4% tested positive for latent TB infection. This is a result among the selected people tested, not an estimate for all migrants or all new arrivals. It should not be extrapolated to the untested group without evidence. Latent infection is distinct from active TB disease; the two measures should not be combined as though they count the same condition.
Why I think this deserves attention
The testing shortfall is a concrete question for prevention policy and service delivery. My carousel argues that the findings deserve more public attention. Its “buried” wording is an editorial judgement, not evidence of deliberate suppression. The report is openly available, and I have not established that mainstream outlets intentionally withheld it.
Group averages cannot determine an individual’s health. These data support examining access to prevention, diagnosis and treatment; they do not establish that birthplace itself causes disease. The maps and arrows are graphics illustrating the topic, not reconstructed transmission routes. The photographs do not establish anyone pictured’s health or immigration status.
Official sources and workings
- UKHSA: Tuberculosis in England, 2026 report, published 29 October 2026.
- Chapter 1: incidence and epidemiology, for birthplace shares, notification rates and national context.
- Chapter 3: diagnosis and microbiology, for the culture-confirmed MDR/RR category and treatment figures.
- Executive summary, for eligible people, testing uptake and latent-infection positivity. All calculations above use the published figures.
The original carousel
The remaining six slides are reproduced below at full portrait proportions. Read them alongside the definitions and source notes above.

Related research
Read my European HIV, TB and hepatitis B report or browse all research topics.
Keep the research going
I study the sources and create the content myself. Support my work on Buy Me a Coffee or send a correction or source suggestion.